Page 1 :
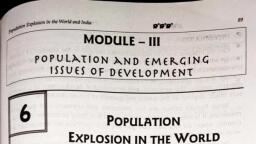
66, , Unit -3, POPULATION AND EMERGING ISSUES, OF DEVELOPMENT, After going through this chapter, you will be able to understand the, following features:, 3.1, 3.2, 3.3, 3.4, , 3.5, 3.6, 3.7, 3.8, 3.9, 3.10, 3.11, 3.12, 3.13, 3.14, 3.15, 3.16, 3.17, 3.18, , Objectives, Introduction, Subject discussion, Population Explosion, a. Demographic concepts, b. Population Explosion in the World and India, Demographic Transition Model, Pattern of Population Growth, Problems of Excess Population, Population Control Measures in India, Human Population and environment, Environment and human health, HDI, World Happiness Index, Summary, Check your Progress/Exercise, Answers to the self-learning questions, Technical words and their meaning, Task, References for further study, , 3.1 OBJECTIVES, By the end of this unit you will be able to –, Understand the, importance of human resources in, environment, Understand the need to have an optimum population in the, world, Understand the benefits and challenges of population, Know the newer trends in population studies.
Page 2 :
67, , 3.2 INTRODUCTION, The study of environment is incomplete without, understanding the role man plays in nature. As the population, numbers are increasing in the world, the resources are becoming, scarce and therefore the onus of controlling population has, emerges as a major step for mankind. Countries like China have, effectively introduced the one child model and reduced their, population, while most developing countries like India are struggling, with the population., , Fig. 3.1 One Child Policy, Population growth and development are linked in complex, ways. Economic development generates resources and revenue, which is used to improve education and health. These, improvements, along with related social changes can moderate and, reduce both fertility and mortality rates. On the contrary, high rates, of population growth put excess pressure on the existing resources, hindering the economic and social development and in turn, education and health.
Page 3 :
68, , 3.3 SUBJECT DISCUSSION, Population is the most integral part of environment and, needs to be studied in detail as it has the capacity to alter all other, components of environment. The population in the world and also, in India is growing rapidly almost touching a 7 billion mark and with, a global projection of 8 billion by 2020., , The human perspective in nature is of three broad kinds Domination- where human domination of nature is prevalent, , Stewardship-development of an exploitative view, more, harmonious relationship between human and environment, and is desirous relation.
Page 4 :
69, Romanticism or deep ecology-has love for nature and, intrinsic value for all forms of life is the idealistic form of man, nature relation., , Population can be a blessing as well as a bane for a nation., Why is Population Beneficial, , Why is Population a Hindrance, , , , , , , Greater consumer base, Excessive pressure on existing, resources-medical,, Large workforce, educational, infrastructure, Greater diversity, Wider and broader political Poor Developmental Indexhousing, sanitation, drinking, machinery, water, Greater potential to use, Social problemsresources, Dissatisfaction, with, the, governments due to limited, funds, , 3.4 POPULATION EXPLOSION, a. Demographic terms to know, , Demography is the population of a place and the features it, represents. It includes the Growth of population, Sex Ratio,, Density of population, Literacy rate, Distribution of, population, Poverty, Age-Sex Ratio and many other, parameters., , , , Census is the decadal count of population of the country, which is tabulated in a country to understand the related, trends of the country. In India the first census was conducted, in the early 19th century by the British, , , , Sex Ratio-It is the number of females per 1000 males in the, country
Page 5 :
70, Sex Ratio 1500, , , , Literacy- The ability of a person to read and write with, understanding. Literacy rate is the number of people who are, literate., , , , Density of Population – is the number of persons living per, square kilometer in an area., , , , Age Sex Pyramid- is a statistical representation of the, percentage of males and females in a mirror graph based on, the specified age groups, e.g., 0-10 years etc., , b. Population Explosion, , Fig. 3.9 Population Projection
Page 6 :
71, The distribution of population in the world has shown wide, fluctuations which has been evident in the manner of growth of, population. It is estimated that at the time of Christ the human, population was only 200 to 300 million(Hussain). The last 10,000, years the population has galloped in two distinct phases, the, agricultural revolution and industrial revolution. The last two, centuries, the doubling of population happened for the whole world., The sharp increase in population is reflected in the J curve or the, almost steep rise of population in the last few decades. Currently, the population in the world stands at 6.4 billion and estimates, suggest it would be 8 billion by 2020., , The causes for the growth of population and also for, population explosion are:, , Poverty- Has been the most important cause of population, growth. Poor people have more children to help them support, their families with working hands. Lack of advancement in, medicine and other social benefits have made them suffer in the, developmental system of the country., , , , Illiteracy- Education is a key enabler to help handle population, increases. Lack of awareness, poor adaptability to the, development goals make them susceptible to being excluded, from the development indices., , , , Infant Mortality- Poor medical facilities result in high infant, mortality and the people tend to have more children as the, survival rates of the infants are low., , , , Social Customs- Social customs like early marriage, poor, position of women in society,preference for the male child,, selected female infanticide in some states are reasons for the, explosion of population in the world., , , , Migration and Immigration- Just like there is natural increase, of population by birth, there is a greater amount of increase in
Page 7 :
72, population that happens through migration of people from one, country, state, region to another., , Fig. 3.11 Growth of Population due to Migration, , , Medical Facilities- Improved medical facilities have resulted in, falling death rate which have increased the longevity of the, people, life expectancy and reduced infant deaths too. This has, lead to an increase in population., , Fig. 3.12 Improved Medical Facilities, , 3.5. DEMOGRAPHIC TRANSITION MODEL, All countries in the world are in different stages of, development. These stages are determined by the selected criteria, that have been made by social scientists to stage the economic, development of the country. One of the most popular model is the, Demographic Transition Model.This model was propounded by, W.S. Thompson (1929) and Frank W. Notestein(1945).It is based, on the fertility and mortality trends in Europe, America and, Australia. It analysed the birth rate and the death rate of all, countries and arrived at a conclusion as to which stage the, economy is. It shows the transition of an economy from an agrarian, to urban modern society., , This is a model based on the gradual progression of society, from an underdeveloped to a developed as per the demographics, of the nation.
Page 8 :
73, , The model has three broad phases:a., Phase I-This is the stage of high underdevelopment and, agrarian community with subsistence. It is characterized by high, birth rate and high fluctuating death rate (pre demographic, transition stage). The stage is characterized by poor medical, facilities, subsistence living, lack of industrial activity, poor, educational standards and overall underdevelopment., b., Phase II-This stage is characterized by high birth rate and, high but declining death rate, also the phase of population, explosion (most under developed to developing countries would fall, in this category). This is a stage of improved health care facilities, which bring down the death rate and the IMR to cause population, growth when the two curves diverge. Improved education,, awareness and governmental efforts gradually enable the growth, rates to fall. Some advanced models further subdivide this phase, into three, Stage of falling birth and death rate, stage of sharper fall, of death rate and a modest reduction of birthrate and maximum, population growth, and the stage of falling and stable death rate, and a sharp falling birth rate., c., Phase III-This is the last stage of the model which is, characterized by low but fluctuating birth rate and low death rate, which can be found in all developed countries., The Demographic Transition Model, , Fig. 3.13 Demographic Transition Model, , 3.6 PATTERN OF POPULATION GROWTH, , , In 1901 the world population was only 1.6 billion., , , , By 1960, it was 3 billion, and by 1987, 5 billion and in 1999, 6, billion., , , , During the last decade there has been substantial decline in, birth rate.The reasons for decline, include;
Page 9 :
74, , Reasons for decline in Birth Rate, a., , Urbanization, , b., , rising educational attainment, , c., , increasing employment among women, , d., , lower infant mortality, , e., , increasing awareness and, , f., improved access to contraception have made it possible, for the majority of the couple to achieve the desired family, size., , , In some countries slowing of the population growth has been, due to an increase in mortality (e.g. HIV related mortality in, sub-saharan Africa)., , , , As a result of all these the decline in the global population, growth during the nineties is steeper than the earlier, predictions., , , , It is expected to decrease to about 64 million by 2020 -25 and, to 33 million by 2045 -50; 95 % of the growth of population, occurs in developing countries., , , , The population distribution is highly uneven. About 75 % of the, people in the world live in less than 15% of the area while the, rest 25% is spread all over., , , , Global density of the world is about 35 persons per square, kilometer while Asia as a landmass has 71 persons per
Page 10 :
75, square kilometer. These variations are dependent on the, physical factors, economic factors and the overall, development of a places., , Fig. 3.16 Population Density - Global average & Asia, , 3.7 PROBLEMS OF EXCESS POPULATION, Rapid population growth is followed by increase in air, water, pollution as more and more people use and contaminate the, environment. There are increased demands for food and hence, agriculture is carried out extensively. These may impact the quality, of land by over use and over irrigation. All resources may be, strained with overuse. Insufficient housing, overcrowding, transport, related road clogging may also result. Excess urbansiation and, migration from the rural areas may cause cities to overflow with, people. Unsanitary conditions, poor sanitation and inadequate, drainage may create unhealthy urban living. Rural areas may see, disguised unemployment and productivity of the lands will fall., Malnutrition and starvation may be seen in areas where the food, resources, have, not, been, distributed, properly.Socially,, unemployment, crime and unrest will result., Summarizing the challenges of rising population:-, , Fig. 3.17 Challenges of rising Population, Environmental stress, Resource degradation, depletion and resource crunch, Poverty
Page 11 :
76, Poor Disaster preparedness, The Planning Commission in its Report on “Population, Growth Trends and Challenges” outlined the following ecological, adverse impacts of excess population on India:a. Severe pressure on the forests due to both the rate of resource, use and the nature of use. The per capita forest biomass in the, country is only about 6 tons as against the global average of 82, tons., b. Adverse effect on species diversity, c. Conversion of habitat to some other land use such as, agriculture, urban development, forestry operation. Some 70-80, % of fresh water marshes and lakes in the Gangetic flood plains, has been lost in the last 50 years., , d. Tropical deforestation and destruction of mangroves for, commercial needs and fuel wood. The country’s mangrove, areas have reduced from 700,000 ha to 453,000 ha in the last, 50 years., e. Intense grazing by domestic livestock, f. Poaching and illegal harvesting of wildlife., g. Increase in agricultural area, high use of chemical fertilizers, pesticides and weedicides; water stagnation, soil erosion, soil, salinity and low productivity., h. High level of biomass burning causing large-scale indoor, pollution., i., , Encroachment on habitat for rail and road construction thereby, fragmenting the habitat. increase in commercial activities such, as mining and unsustainable resource extraction., , j., , Degradation of coastal and other aquatic ecosystems from, domestic sewage, pesticides, fertilizers and industrial effluents., , k. Over fishing in water bodies and introduction of weeds and, exotic species
Page 12 :
77, l., , Diversion of water for domestic, industrial and agricultural uses, leading to increased river pollution and decrease in self-cleaning, properties of rivers, , m. Increasing water requirement leading to tapping deeper aquifers, which have high content of arsenic or fluoride resulting health, problems., n. Disturbance from increased recreational activity and tourism, causing pollution of natural ecosystems with wastes left behind, by people., , 3.8. POPULATION CONTROL MEASURES IN INDIA, The population policy in India is a fallout of the plan periods, and has achieved modest results. As the country stands as the, second populous country and has over a billion population, the, policies have to be implemented really effectively for any desired, benefits., Important Milestones in of the, Population Policy of India, , 1946- Bhore, Report, , Committee, , 1952-family, planning, programme launched, , 1976-National, Statement, , Policy, , 1977-Family, Programme, statement, , 1991-Karunakaran, committee( NDC), , Welfare, policy, , 1993Karunakaran, report accepted as the, NPP, , 1994-Dr.Swaminathan, Expert report-on population, policy, , 1998-99-opinions sought, on the policy, , 2000- accepted as the new, NPP, , National Population Policy-2000, The NPP is implemented by the National Commission on, Population and has been attempting to stabilize the population of, the country with the help of the following measures: Infrastructure for basic reproductive and child health, School education upto 14 yrs, Reduction of the IMR to below 30 persons /100 live births, Reduction of the maternal mortality to below 100/100000 live, births
Page 13 :
78, Achieve universal immunization, preventive diseases, , of, , children, , against, , all, , Achieve 80% institutional deliveries and by trained persons, Universal access to information ,counseling, contraception, Achieve 100% registration of births and deaths and marriage, Contain AIDS, communicable diseases, Promote small family norms, Make emphasis on people centric program National Population, Policy-2000, Objectives of the Policy, a. Long Term Objectives- i) stable population by 2045, ii) sustainable economic growth with social and environmental, development, b. Medium Term Objectives- Inter sectoral operational strategies to, enable achievement of the policy objectives, c. Short Term Objectives-Meet the medical and health care needs, , Evaluation of the Policy, NPP has been operational and implemented for more than two, decades. Yet the success rate is poor. Reasons for low success, are:, , Fig. 3.20 Reasons for Low Success of N.P.P.
Page 14 :
79, , , , , , , , , Poverty, Illiteracy, Religion, Lack of motivation, Low status of women, Poor implementation, Voluntary and hence slow, , The NPP however, reaffirms the government’s determination, to reduce the population numbers. Health facilities may have, improved yet there are several areas in the country where there are, limited or no facilities. Education has been boosted with right to, education, mid day meal schemes, freeship for the girl child etc. to, enable inclusiveness. Awareness and penetration of neonatal and, infant care has improved., , 3.9. HUMAN POPULATION AND ENVIRONMENT, Concept of the Carrying Capacity and the Tragedy of, Commons: Garret Hardin in his classic essay “tragedy of commons”, in 1968, stressed that every ecosystem has a threshold or a limit of, supporting the population. This is determined by the amount of, respuces and the dependable population in the area. Whether, population increases by natural increase or migration, beyond a, certain limit there is experience of stress. This ideal numbers which, any environmental space can hold without any damage to the, environment is called the carrying capacity of the ecosystem or the, environment. He explained this in his famous essay Tragedy of, Commons., The study of human population is important for the following, reasons,, a. Man is an integral part of the environment, b. Has a dual role as a producer and consumer of resources, c. The changing roles of man in nature from dependency to, supremacy, d. Maintain a harmony in the environment, There are three types of activities that are carried on by man, to alter and create resources. They are, Primary activities like, farming, fishing. Secondary activities like industries and Tertiary, activities are the service based.
Page 15 :
80, , 3.10 ENVIRONMENT AND HUMAN HEALTH, The relation between health and environment is indeed, interesting. The presence of greater number of people in an area, causes health problems that need to be studied. Overcrowding, leads to shortages, which in turn, may cause unequal distribution of, medical and other necessary resources. The rate of population, growth affects long-range planning of community health and, medical facilities. Also any changes in age composition, migration, changes in population density and urban-rural movement may, result in changing the entire health program of an area. In, advanced nations population trends like aging of the population is, the most fundamental aim on their national health, policy. Environmental health, as defined by WHO, comprises those, aspects of human health, including quality of life, that are, determined by physical, chemical, biological, social, and, psychosocial factors in the environment. It also refers to the theory, and practice of assessing, correcting, controlling, and preventing, those factors in the environment that adversely affect the health of, present and future generations.( Bharucha), Our environment affects health in a variety of ways., , , Climate and weather affect human health., , , , Public health depends on sufficient amounts of good quality, food, safe drinking water, and adequate shelter, , , , Natural disasters such as storms, hurricanes, and floods still kill, many people every year. Unprecedented rainfall trigger, epidemics of malaria and water borne diseases., , , , Food Shortages and resulting Poverty, , , , Spread of diseases and combating them, , Definition of Health Impact Assessment (HIA) by World, Health Organisation: Health impact assessment is a combination of, procedures, methods and tools by which a policy, program or, project may be judged as to its potential effects on the health of a, population, and the distribution of those effects within the, population Concerns in Diseases due to unregulated health in, highly populated areas, i., , Infectious diseases- Those that spread through direct, contact. Tuberculosis has a virulent strain which is highly, contagious., , ii., , Vector Borne- Those that spread by carrier vectors like, rodents, mosquito, like malaria, leptospirosis., , iii., , Water Borne- Those spreading through consumption of, contaminated water like cholera
Page 16 :
81, iv., , Mutated Varieties- All virus spread diseases which have, mutated such as the flu, avian flu, , v., , Inoculations and Vaccination issues-As the whole world, have irradiated diseases like yellow fever and small pox;, inoculations have to be made to ensure that they are in check., A good example is that of polio which was a drop administered, inoculation has move to become injected one to make it more, effective. Congested and overpopulated areas can be a, problem in the ability of the administration to reach out to all, section of the society. Some of these may reoccur if not, administered on time. Awareness and education of the people, has to be made to ensure that the timely administering of the, drugs occur., , 3.11 HUMAN DEVELOPMENT INDEX (HDI), Is a measure of development in the world. It has been, introduced by the UNDP to emphasize the level of development of, the countries. It was introduced by Prof Amartya Sen, Lord, Meghnad Desai And Dr. Mahabubul Haq. The objective of the, ranking index is to enable the society to lead a quality life., , , The parameters of the HDI as measured are:1., Life span, 2., Literacy, 3., Income per Capita for quality of life, , The Human Development Index (HDI) is a summary, measure of average achievement in key dimensions of human, development: a long and healthy life, being knowledgeable and, have a decent standard of living. It is calculated as a geometric, mean of normalized indices for each of the three dimensions. The, health dimension is assessed by life expectancy at birth, the, education dimension is measured by mean of years of schooling for, adults aged 25 years and more and expected years of schooling for, children of school entering age. The standard of living dimension is, measured by gross national income per capita. The HDI uses the, logarithm of income, to reflect the diminishing importance of income, with increasing GNI., Much later in 1995, the Gender Development Index (GDI), was introduced as an index to measure of gender equality. GDI, together with the Gender Empowerment Measure (GEM) were, introduced in 1995 in the Human Development Report of the, UNDP., The Gender Inequality Index (GII), is, an index for, measurement of gender disparity that was introduced in the 2010
Page 17 :
82, Human Development Report 20th anniversary edition by the United, Nations Development Programme (UNDP)., Name, Country, , of, , the HDI Rank 2015, Index, released in 2016, , Norway, , 1, , 0.94, , Australia, , 2, , 0.93, , Switzerland, , 3, , 0.93, , India, , 131, , 0.62, , India falls in the medium developed countries in the world., Most livable Countries in the world today remain the, Scandinavian countries and the Western European Countries, such as Norway, Iceland, Sweden, Austria, Netherlands,, Belgium, USA, Canada, Japan, Switzerland, Denmark, Ireland,, UK, etc, Least Livable Countries-Sierra Leone, Niger, Burkina Faso,, Mali, Burundi, Mozambique etc., HDI in Indian states, The HDI is the highest for Kerala (0.625) followed by Punjab, (0.569) and the lowest for Orissa(0.569) while Bihar (0.447), and Chhattisgarh (0.449) .Maharashtra has (0.549) ., , 3.12 WORLD HAPPINESS INDEX, In 2012 ,the World introduced the World Happiness Index, .The report is generated from a survey of the state of global, happiness. The World Happiness Report 2017, which ranks 155, countries by their happiness levels, was released in March, 2017, and ranked India 122 out of 155 nations.In June 2016, the OECD, worked to “to redefine the growth narrative to put people’s wellbeing at the center of governments’ efforts”.In February 2017, the, United Arab Emirates held a full-day World Happiness meeting, as, part of the World Government Summit.Thereafter, on World, Happiness Day, March 20th, the launch the World Happiness, Report 2017 was made. Norway has jumped from 4th place in 2016, to 1st place this year, followed by Denmark, Iceland and, Switzerland. 80% of the variance of happiness across the world, occurs within developed countries. In richer countries the, differences are not by income inequality, but by differences in, mental health, physical health and personal relationships: the, biggest single source of misery is mental illness. Income, differences matter more in poorer countries, but even there mental, illness is prevalent.
Page 18 :
83, , 3.13 SUMMARY, Demographic studies are an important determinant of the, study of environment. Previously man was highly dependent on, nature but as he progressed technologically, he learned to combat, the uncontrollable natural forces. This helped him to develop and, confront the many natural forces. Gradually societies progressed, from agrarian to urban and the environmental degradation began., Just as excess population can be a hinderance, under population, too can result in underdevelopment. Hence the scope of the study, become more and more defined as man also learns to improve the, quality of living through human development and sustainable, development., , 3.14.CHECK YOUR PROGRESS/EXERCISE, 1. True or False, a. India ranks 105 in the World Happiness Index., b. The global population is currently at 8 billion., c. India falls in the Phase 1 of the DTM, d. India follows no defined policy on population control, e. Census is collected every 5 years., 2. Fill in the Blanks, a. India ranks _____in the World Happiness Index, b. ________is a parameter for HDI, c. ____________state in India has the highest HDI., d. MDGs stand for___________, e. NPP stands for ________________., 3. Multiple Choice Questions, a. Concept of Carrying Capacity was given by, i. T. Malthus, ii. Garret Hardin, iii. Odum, iv. A Zimmerman, b. DTM has _____phases., i. One, ii. Two, iii. Three, iv. four, c. Human population rose sharply during the _____________., i. Paleolithic, ii. Neolithic, iii. Industrial Revolution, iv. None of the above
Page 19 :
84, d. Global population is highly concentrated in which continent, _____, i. Asia, ii.Africa, iii.Europe, iv. Australia, e. ________ has the largest population in the world., i.India, ii.China, iii. Brazil, iv. Australia, , 3.15 ANSWERS TO THE SELF-LEARNING, QUESTIONS, 1. True or False, 1.a. False, 1.b. False, 1.c. False, 1.d. False, 1.e. False, 2. Fill in the Blanks, 2.a. 122, 2.b. Longivity, 2.c. Kerala, 2.d. Millinium Development Goals, 2e. National Population Policy, 3. Multiple Choice Questions, 3.a. (ii), 3.b. (iii), 3.c. (iii), 3.d. (i), 3.e. (i), , 3.16 TECHNICAL WORDS AND THEIR MEANINGS, , , Census- The decadal compoting of demographic data in a, country., , , , The Gender Inequality Index (GII), is, an index for, measurement of gender disparity that was introduced in the, 2010 Human Development Report 20th anniversary edition by, the United Nations Development Programme (UNDP).
Page 20 :
85, , 3.17 TASK, , , Make a questionnaire for the students in your class and find out, the following:- Literacy level in their families, - Awareness about girl child education, - RTE, , 3.18 REFERENCES FOR FURTHER STUDY, , , , , , , , Basics in Environmental Studies, Dr. Pushpendra, Environmental Management, Swapan Deb., Human Geography, Majid Hussain., Environment and Sustainable Development, Sundar, I., World Development Report- Annual, Census of India, 2011., , , , , ,