Page 3 :
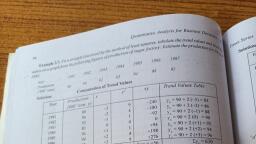
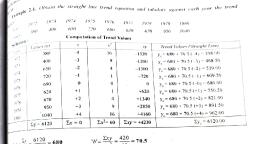
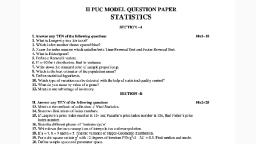
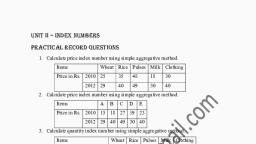
{ANAL : 25 NS - 424, , 6. Obtain the rank coefficient of correlation from the following data., , , , Prize of Tea (Rs.) 75 | 88 95 |* 70-} 60=|-80+|+-84 50, , , , Prize of Coffee (Rs.) : | 120 | 134 | 150 | 115] 110 | 140] 142 | 100, BY Bebidas BeQosHow ' AOWT*ahN”’S On, 08° AGAOWOD ABMOLBWAd BONBON., , , , , , wanaid(de.) | 75 | 88 | 95 | 70] 60 | 80] 81 | 50, , , , , , , , , , , , , , , , , , , , , , , , Togow WE (Ge.): 120 | 134 | 150 | 115] 110 | 140} 142 | 100, , oS SECTION-C, , Answer any three questions from the following. Each question carries, fourteen marks. (3x14=42), , , , 7. The following data relates to the number of passenger car (in Millions) sold from, 2000 to 2006., , , , Year: . | 2000 | 2001 2002 | 2003 | 2004 | 2005 | 2006, , , , , , Number : 6.7 5.3 4.3 6.1 5.6 79 5.8, , , , , , , , , , , , , , , , , , , , a) Fit a straight line trend to the data and obtain the trend i values., b) Estimate the sale of cars for the year 2010., , BET FHBYOID BV&%, 2000 O00 20060 Hd HHAvs WdMY Boos, , , , , , , , , , , , , , , , , , , , , , , , , , (asdomatpe9),, Rar: 2000 | 2001 | 2002 | 2003 | 2004 | 2005 | 2006, Rost Hosd, : | 67 53 43 61 5.6 79 5.8, a) Baws Gos Gosreri Ade Basen a BROA, Zag BPO, ride, 20783680000., , b) 2010S¢ Bars maT ATA, CoB., , 8. From the following data, find out the number of students who secured more than, 40 but less than 45 marks. :, , , , , , , , , , , , , , , , , , , , , , Marks : 30-40 | 40-50 | 50-60 | 60-70 | 70-80, No. of students :| 31 42 S14 35 31, oer SREIDIS BeoSoI08 40303 BV, SO845 osnohos FB BROWS Now Orne, R033, Socal) BOI., woene: 30-40 | 40-50 | 50-60 | 60-70 | 70-80., ADY.DENYE Hod, a} 8t 42 51 35 31
Page 4 :
10., , ail,, , NS — 424, , 9. From the following data on six cities, calculate the coefficient of correlation, , 4., , between density of population and death rate., , UA, , , , , , , , , , , , , , , , , , , , , , , , , , , , , , , , , , , , , , , , , , , , , , , , , , , , , , , , , , , , , , , , , , , , , , , , , , , , , , , , City : B C D 5 F, Density of population : 500 | 400 700 600 300, Population ('000) : 90 | 40 42 12, 24, No. of deaths : 1440 | 560 | 840 | 1224 | 312, 20R Batichs Anbsctood ‘nAmoas ' sod) ‘sode Sanee’g adod Aatowe, HEMI BOBO., and: B26 =p E F, wanosd MOBS: 500 | 400 | 700 | 600 | 300, wasosg,: 90 40 42 72 24, aodro dos: 1440 | 560 | 840 | 1224 | 312,, Estimate the revenue generated for the year 2013 and 2015 from the following, table., Year : 2010 | 2011 | 2012 | 2013 | 2014 | 2015 | 2016, Revenue (Rs. in Crores) : 120 | 150 - 210 - |:320, 2013 sive)2015ae dele rie ered evs wormeze., sae: 2010 | 2011 | 2012 | 2013 | 2014 | 2015 | 2016, mod (Bees te.):| 100 | 120 | 150 = 210 - 320, , , , , , , , x 40 50, , 60, , 65, , 50, , 35, , , , , , , , Y 38 60, , , , 70, , , , 60, , , , 48, , , , , , 30, , , , , , x 40 50, , 60, , 65, , 50, , 35, , , , Y 38 60, , , , , , , , , , 70, , , , 60, , , , 48, , , , 30, , , , , , , , Obtain the two regression equations from the following data and estimate the, value of X when Y = 50 and the value of Y when X = 45., , Beri BIB QNSONGOG ade soowsasoud RaMoeaengay BowdkoBou0o wor = 50 emer, 'X' edodsay BozQ X = 45 amen 'Y’ web), BomMwBNo.
