Page 1 :
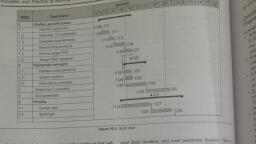
CHAPTER, , 16, , , , Competencies, Introduction, © What is a network?, © Major techniques for time event network analysis, = Gantt chart, © Introduction and meaning, @ Advantages, = Milestone budgeting, _ © Concept, © Advantages, = PERT/CPM, - ® Introduction and meaning, © _ Definition of terms used in CPM and PERT, @ Purposes of CPM and PERT, © s in CPM and PERT, Applications, General problems in use of network analysis, , jer readings, , oy, , , , , , , COMPETENCIES, , After completion of this chapter, the learner will be able to:, , O Understand the concept of Time Event Network Analysis as, ualitative planning methods, , details about meaning and advantages of Gantt, , , , , , , , , , , , , , , , , problems in use of network, , Qualitative Planning Method,, , , , , , , , , sult, hospitals are absorbing tremendous,, ‘herefore for the optimization of TesOUrces, mprovement, application of netwo,,, ses is must, The methods of network, , consumption. As a re, amount of resources. T, and continuous quality |, , analysis to hospital proces:, Vs oals for patients and provide the corresponding, , analysis display a res, taal sequence and timing of staff actions for achieving those, , goals with optimal efficiency., , What is a Network?, A network is a graphic plan of all the events and activities to be, completed in order to reach to the end objectives This is, undertaken to ensue tat the programme or project is completed, within the stipulated time. This is very important quantitative, method for planning and controlling., , Major Techniques for Time Event Network Analysis, , There are three major techniques for this analysis: Gantt char,, Milestone budgeting and Programme Evaluation and Review, Technique (PERT) and Critical Path Method (CPM)., , Gantt Chart, , This type of chart was invented in 1910 bya mechanical engineer, named Henry Gantt, and there are now a great many software, tools that use gantt charts in project planning. Excel is a popular, tool for creating Gantt charts, but for more advanced project, management activities, The Gantt chart is an excellent tool for, quickly assessing the status of a project or programme. This, technique has been invented by a mechanical engineer named, Charles Henery Gantt in 1910., , A Gantt chart is a simple graphical chart depicting various, tasks, activities or events performed in the stipulated time frame, work or against the progression of time in the form of bar diagram., Since it gives a graphical illustration of a schedule that helps to, plan, coordinate, and track specific tasks in a project and used, by project managers to control projects and administer the tasks, required to complete a project. Projects usually involve mor, than one person or more than one step poses many questions, and the answer is the time oriented diagram i.e. the Gantt chat"., , Construction, , i constructed with a horizontal axis representing the total time, project , broken down into increments (days, weeks
