Page 1 :
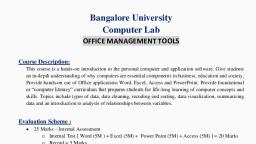
Office Management Tools, Course Description:, This course is a hands-on introduction to the personal computer and application software., Give students an in-depth understanding of why computers are essential components in business,, education and society. Provide hands-on use of Office applications Word, Excel, Access and, PowerPoint. Provide foundational or “computer literacy” curriculum that prepares students for lifelong learning of computer concepts and skills. Topics include types of data, data cleaning, recoding, and sorting, data visualization, summarizing data and an introduction to analysis of relationships, between variables., , Course Outline:, 1. Basic Skills, In and out view of different components of computer (Hardware), booting the machine, GUI, of desktop, input and output interfacing, 2. Word, Introduction Word - Uses of Word Processor – Working with Word - Explore the use of, graphics and different fonts, understand and to make use of basic features of documents,, Advanced Word Processing - Managing Document Changes - Advanced Editing and, Formatting - Protecting and Sharing Documents - Customizing Documents - Using Macros,, Quick parts, and Content Links - Using Fields, Forms and Indexes, 3. Excel [Spreadsheets], Introduction Spreadsheets - Uses of Spreadsheets - Anatomy of a Spreadsheet - Creating a, Spreadsheet - Formatting a Spreadsheet- Explore the tools available in spreadsheets,, including formulas and calculations, Inserting and working on Graphs, Using office, backstage - Using basic formulas - Using functions -Formatting cells and Ranges Formatting worksheets - Managing worksheets - Working with data and Macros - Using, advanced formulas - Securing and sharing workbooks - Creating charts - Adding pictures and, shapes to a worksheet., 4. Power Point Presentation, Introduction Power point presentation (PPT) – Uses of PPT - Creating and Formatting a, Presentation - Slide Show Mode, Speaker Notes, and Outline Mode - Drawing Diagrams Tables and Charts, review each slide template - Duplicate, move and import slides Insert pictures and video clips - manage add-ins and security options - Create handouts Create and apply master slides - Manage proofing options - manage language options Use “Presenter Tools”- Connect to the projection system., 5. Use of Excel for Statistical Analysis, Data Classification and Presentation - Cumulative Frequency Distribution - Bivariate, Frequency Distributions - Tabulation of Data - Graphical Representation - Other Forms of, Representation Measures of Location and Dispersion - The Arithmetic Mean – The Median –
Page 2 :
The Mode – Geometric and Harmonic Mean – Other methods of Location: Quartiles, Deciles, and Percentiles – Measures of Variations or Dispersion – The Variance and Standard, Deviation. Correlation - Scatter diagram – correlation coefficient, 6. ACCESS, Overview of Microsoft Access Databases – Design and Create Tables to Store Data –, Simplify Data Entry with Forms - Obtain Valuable Information Using Queries - Create, Professional Quality Output with Reports – Design and Implement Powerful Relational, Databases - Build User Friendly Database Systems, , Readings:, 1. Wiley, “Microsoft Official Academic Course for ‘Microsoft Word’, ‘Microsoft Excel’,, “Microsoft PPT”., 2., , Access 2016 Bible: The Comprehensive Tutorial Guide” by Michael Alexander and Dick Kusleika., , 3. Berk, K. N. and Carey, P., “Data Analysis with Microsoft Excel, Duxbury Press, 2000., 4. Medhi .J, “Statistical Methods an introductory text”., 5. Kenneth N. Berk and Patrick Carey, “Data Analysis with Microsoft Excel”.

