Page 1 :
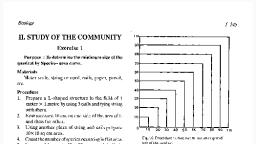
Ecology, , [ 345, , II. STUDY OF THE COMMUNITY, Exercise 1, Purpose : To determine the minimum size of the, quadrat by Species- ar:ea curve., , 1m, , 90, 80, 70, , Materials, Meter scale, string or cord, nails, paper, pencil,, etc., , 60, , Procedure, 1. Prepare a L-shaped structure in the field of 1, meter X 1 metre by using 3 nails and tying string, with them., 2. Now measure 10 cm on one side of the arm of L, and then the other., 3. Using another piece of string and nails prepare, 10 X 10 sq cm area., 4. Count the number of species occurring in this area., 5. Increase this area to 20 X 20 sq.cm and similarly, record additional species occurring in this area., 6. Repeat the same procedure till 1 X 1 sq meter, area is covered., 7. Note down the observations as follows., , 40, , 50, , 30, 20, 10, , o, , n, 10, , 20, , 30, , 40, , SO, , 60, , 70, , 80, , 90, , 1m, , Fig. 16. Procedure to fmd out minimum required, size of the quadrat., , 40, , Table 1.Total number of species and the area., Area, r-~~~~~~------, , Total no. of species, ----------~--~~~---, , 10 x 10 sq.cm, 20 x 20 sq.cm, 30 x 30 sq.cm, upto, 100 x 100 sq.cm, , 300, , 400, , Fig. 17. Spcclcs-arca curvc to dctermmc the, size of thc quadrat., , Exercise 2, 8., , Using the above recorded data, prepare a graph., Number of species are plotted on Y axis and sizq, of the quadrats on X axis., , Results, At one point of the graph, curve starts flattening, or shows only a gradual increase., Conclusion, The point of the graph, at which steep increase of, the curve becomes gradual or curve flattens, denotes, minimum area of the quadrat suitable for the study, of an area under consideration., , Purpose: To determine the frequency of various, species occurring in a given area., Materials, Quadrats of required size. measuring tape,, paper, pencil, etc., Procedure, The following are some of the common methods., [I] Quadrat, 1. Take a quadrat of suitable size, lay it randomly at, number of places., 2. Identify the species or distinguish them as A, B,, C, etc.
Page 2 :
J, , 346, , Practical Botany: Vol 2, If the species are not identified taxonomically in, the field, collect them, glue or fix with cello tape, to herbarium sheets, use the same identification, marks, e.g., A, B, C, etc. as used in the table and, properly preserve the sheets., , 4., , [II] Line tran.sect, 1. In a grassland, line transect can also be used for, determining frequency ., 2. A measuring tape or a cord marked into one, meter segments is used., 3. Take a tapc or cord across the grassland in, North-South direction., 4. Note the presence or absence of plant species in, each one meter segment. Only those plant, species are considered which touch the cord or, tape., , .,, E, ~D~--1---+---r--i---r--~--+-~r--i--~, , .,.,, , 50 ems, FIg. 18. A quadrat., , 3., , Find out the presence or absence of each of the, species in each segment (square) of the quadrat, and tabulate the data., , [III] Belt transect, Similar method IS used In belt transects. The, plant species occurring in alternate segments or, uniform area are recorded., Results, The record of the observations is kept, following way (refer to table 2), , Table 2. To determine the frequency of various species., , ---tJ, , ..., , ~, , tJ, II), , =, S, , <II, , <II, , <II, , ~, , "0, , <II, , !:, , :$, , =, ';, , ·c, <I, , rJJ, , 1., 2., 3., 4., 5., 6., 7., 8., 9., 10, 11., 12., 13., 14., 15., 16, , ..., , <II, , S, , Alysicarpus monilifer, Convolvulus pluricaulis, Cynodon dactylon, Cyperus rotilndus, Desmodium triflorum, Dichanthium annulatum, Eclipta alba, Euphorbia hirta, Evolvulus nummularius, Gomphrena globosa, Indigofera limfolia, Launea nudicaulis, Phyllanthus niruri, Rhynchosia minima, Sida cordifolia, Ikrnollia cinerea, , o .~'", , -, , i'!, "0, , = =, , ~, -=g,, Z oS, , ~, , :$, , Z, 1, 5, 10, 15, , -, , -, , I, , 2, 5, 10, 6, 12, , I, , -, , I, , 4, , -, , I, , -, , -, , 13, , 15, , -, , -, , -, , 12, 5, , -, , 12, , 10, , 11, , 6, , 4, , 6, , -, , -, , -, , -, , 2, , 4, , -, , -, , -, , -, , -, , -, , -, , -, , 11, , ... :c=, , -, , :$, , -, , 0"', , u'", ~, , ~, , », , "=, =, 0"', <II, , ..., , <II, , ~, , », , ", =, =, ...'=, ", <II, , 0"', , ~, , '", , ~, , '", =, =, ~, , 'iii, , "0, , <II, , ~, , =, , Q, , 5, , -, , 3, 3, , <II, , ~, , 12, , -, , <II, , III, , ..!l, , 0"', , 3, , <II, , = -.'!l'", =, ~, =~, -;.t;, :s, i, e, ~, ~, = = '=, " ...= =, ...= ...= ...., lI), , <I', , Q., , <II, , .~, , II), , -0, , 'IJ, , =, ...O"'~Q., =• ..<:: "0, = ........, '", ~, , ~, , = ''"", , ..., , .:, , the, , In, , -, , 1, 6, , 2, , 4, 6, , 3, 2, 3, 4, , -, , -, , -, , 10, 10, 65, 6, 12, 45, 15, 410, 3, 12, 6, 3, 2, 7, 2 12, 11, , 2, 1, 5, 1, 1, 4, 3, 2, 1, 5, 1, 1, 1, 2, 3, 1, , Number of plants in each frequency class. A = 8, 13 = 3, C = 2, D ';" 1, E = 2, , 5, 5, 5, 5, 5, 5, 5, 5, 5, 5, 5, 5, 5, 5, 5, 5, , 40, 20, 100, 20, 20, 80, 60 ', 40, 20, 100, 20, 20, 20, 40, 60, 20, , B, A, E, A, A, D, C, B, A, E, A, A, A, B, C, A, , 2, 2, , 5, 10, , 13, , 13, , 1.2, 2.4, 9, 3, 2, 0.3, 2.4, 1.2, 0.6, 0.4, 1.4, 2.4, 2.2, , 6, 12, 11.25, 5, 5, 6, 2.4, 6, 3, 2, 3.5, 4, , 11
Page 3 :
Ecology, , [ 347, , Calculations, 1. Calculate the percentage frequency as followsPercentage frequency =, Total number of guadrats / segments, in which speCIes occurred, x 100, Total number of quadrats /, segments studied, 2. Distribute various species into five frequency, classes (Raunkaier, 1934) as given below--, , % of the total number of species:, , 10, , 20, , 30, , 40, , 50, , 60, , Table 3. Distribution in frequency classes., Frequency %, , Frequency class, , 1-20 %, 21-40 %, 41-60 %, 61- 80 %, E1-100 %, , A, B, C, D, E, , Fig. 19. Frequency diagram of the place studied., , Write down the frequency class in appropriate, column against each species., 3. The distribution of sixteen species in five, frequency classes is A = 8, B = 3, C = 2,, D = 1 and E = 2. Find out the percentage of, these species falling into different frequency, classes as follows out of the total number of, species recorded., No. of species falling in frequency class, 100, Total number of species recorded, x, for frequency class, frequency class, frequency class, frequency class, frequency class, , A, B, C, D, E, , = 8/16 x 100 = 50, 3/16 x 100 = 18.75, , =, , =, , 2/16 x 100 = 12.5, , = 1/16 x 100 = 6.25, = 2/16 x 100 = 12.5, , 4. Take a graph sheet and show % of the total number, of species on y-axis and the frequency classes on, x-axis. This is known as frequency diagram., Conclusions, 1. Compare the frequency diagram of the place, studied with that of Raunkiaer's normal, frequency diagram, 2. When values of frequency classes B,C and Dare, comparatively higher than their values in normal, frequency diagram, the vegetation is said to be, heterogenous, as is the case in the present study., (higher values of class E indicate homogeneity, of vegetation)., 3. Also compare the figures with frequency figures, proposed by Raunkiaer as Law of Frequency, given below, , >, , A>B>C<D<E, , % of the total number of species, , 10, , 20, , 30, , 40, , A~______________, , 50, , r -________________________________________, , ~, , ...--_----11 14, , B 1--_______, , >- C, U, , ~, , \9, , ~-...,....., , 1D, , \8, , E, , Fig. 20. Raunklaer's normal frequency diagram., , ~j53
Page 4 :
348, , J, , Practical Botany: Vol 2 •, , Table 4. To determine the density and abundance., 1, , 2, , S., No., , Name, of the, plant, species, , I, , 3, , No. of individuals, per quadrat, , I1, , 121314, , ,, , 5, , I, , A, , I, , Total no. of, individuals, of a species, , 5, No. of quadrats, in which species, occurred, , I, , 6, , Total no. of, quadrats, studied, , 7, , 8, , Density, , Abundance, , I, , I, , I, , I, , n, , c, , I, , 4, , [, , I, , Exercise 3, Purpose: To determine the density/abundance of, various species occurring in given area., Materials, Quadrat of required size, paper, pencil, etc., Procedure, 1. Take a quadrat of suitable size and lay randomly, at number of places in an area under study., 2. Identify the species or distinguish them as A, B,, C, ctc. If it is difficult to identify the species, taxonomically in the field, collect them, glue or, fix by cellotape to herbarium sheets, put the, same identification marks e.g., A,B,C, etc. and, preserve the sheets., 3. Count the number of individuals of each species, from each square of the quadrat., 4. Record observations in a tabular form., Observation, Note down your observation III the following, table - (refer to table 1 also), Conslusions, (1) Density = an average number of individuals, of a given species over the total number of samples, studied in an area., Total number of individuals of a species, Total number of quadrats studied, value in column no. 4 value in column no. 6, (2) Abundance = the number of individuals of a, given species per unit area (quadrat) of occurrence., Total number of individuals of a species, Total number of quadrats occurrence, value III column no. 4, value in column no. 5, , Density gives the numerical strength of a species, in a comm~nity. Abundance, on the other hand,, gives the number of individuals of a species in a, habitat., Generally, frequency and abundance are, co-related to find out the distribution of a species., (a) High frequency X low abundance, = regular distribution, (b) Low frequency X high abundance, = contagious distribution, , Exercise 4, Purpose: To determine the vegetational cover in, a given area., Materials, Measuring tape, Vernier callipers, SCissors,, paper, pencil, etc., Procedure, The following are the two common methods., , [I] Line intercept method A, Take a measuring tape across the grassland., Measure and note the length of the tape, intercepted, by individual plants., , [II] Line intercept method B, Cut a few stems of individual species at the, ground surface. Measure the diameter of the cut end, by Vernier callipers. Alternatively measure the, diameter of the plant at a fixed height above the, ground level., Conclusion. I. List the observations in the, following way -
Page 5 :
Ecology, , [ 349, , Tabk 5. To determine vegetational cover., Length of, Individuals, , I Namcof, , Serial, no., , plant, species, , 1, , A, , 2, , B, C, 0, E, , 3, 4, 5, Total no. of, plant sps., , 2, , 1, , I, , 4, , 3, , 5, , Total %, , I, , I·, , Total no. of, individuals studied., , Total length of, all the Individuals, , Calculate (a) total length of transect covered by, all thc species and (b) percentage of total length of, transect covered by different species. This gives, percentage cover., Relative cover percentage =, length of one type, x 100, total length of all the individuals, II. Tabulate in the following form -, , Tabk 6. To calculate vegetational cover., Serial, no., , 1, 2, 3, 4, 5, , Name of, plant, species, , I, , Diameter, of. Individuals, 1, , 2, , 3, , 4, , 5, , Total, , Average, , A, B, C, 0, E, Total basal area of all species -, , Calculate by using Average basal area =][r 2, ·, diameter (Average), Wh ere r = ra d IUS =, •, 2, If multiplied by the value of ~nsity (D) D x average basal area = ...... sq cm/sq meter., , Exercise 5, Purpose: Estimation of biomass.*, Material, Scissors, polythene bags, oven, balance, etc., , Procedure, The following three methods are commonly used,, 1. A small sampling unit (e.g. 25 x 25 cm) is chosen, and plants are cut close to the ground surface., 2. Seclee, ndomly a few plants (e.g.,about five), from a sampling unit, the density for which has, already been calculated., 3. In a pond, lower a container (known as dredge), of known volume which opens by special, mechanism only after lowering it under water, surface at desired depth and then close down., In all the cases, each sample is packed in sulitable, plastic bags, dried in the laboratory (blotting papers, are used for aquatic plants), weighed and.cut into in, smaller and suitable pieces., Take 1000 g of each sample and dry it in an oven, at 70°C for 12- 24 hours. Note down the dry weight., Calculate the biomass(dry weight) per meter, square area., (a) Take into consideration the fresh weight and, the dry weight of 1000 g from the sample., (b) Calculate the dry weight for this fresh weight, of a sample., (c) Now determine .he area from which the, sample is collected and calculate the value for one, square meter., Xg, Calculations. 1. Fresh weight, 2. Weight after heating, (at 74°C for 24 hrs), Yg, .., Dry weight, Yg, Find out the biomass per unit area e.g. the size of, the quadrat used was 25 cm x 25 cm = 625 cm 2 and, Y g was the dry weight, .. biomass for 1m X 1m (100 em X 100 cm) would be, Yg x 100 X 100 = Z 1m2, 625, g, 2, As such biomass would be Zgim, , Exercise 6, Purpose : Determination of local vegetation:, frequency and relative frequency, density and, relative density and importance value index., Materials, Ouadrats, measuring tape, paper pencil, etc., , 'Biomass and standing crop, both are synonyms. Biomass can be expresscd 111 terms of number and mca~ured as fresh weight (liVIng, weight), dry wClght, ash-free dry weight. enerb'Y or any c0I1ventionai U11.t which .~ found u~cful for the purpose of compan~on., Thus, the simplest way IS to determ111e fresh weight of the samples and calculate It for a square meter area.
Page 6 :
350, , I, , Practical Botany: Vol 2, , =, , Table 7. To determine frequency, relative frequency,, , 1. Relative dominance, Total basal area of the species x 100, Total basal area all the species, , density relative density and importance value, index., 2, , 1, , Serial, no., , 1, , Name of, , 5, , 4, , 3, Relative, , Relative, , =, , 6, , 2. Relative density, Number of individuals of the species, x 100, Number of individuals of all the speCIeS, , IVI, , Relative, , ::1~ f=~fk~UY f~', , (3+4+5), , =, , 3. Relative frequency, Number of occurrences of the species, --------'---=---~~.=-- x 100, Number of occurrences of all the specIes, Record the values obtanied in the following table, , 2, 3, 4, 5, , Eli, ,, , Exercise 7, , I, , Purpose: To study the species composition of an, area for analysing biological spectrum and, comparison with Raunkiaer's normal biological, spectrum., , Arrange the spccies in decreasing values of IVI., Procedure, 1. Lay thc quadrats, idcntify the species, count, their number in each quadrat and record the, obscrvations in a tabular form as done earlier, (table 1)., 2. Use line transect or belt transect as done earlier, (exercise no.2) and retord the observations as, per table 1., , Materials, Record book, pen, pencil, etc., Procedure, 1. Visit the area under study., 2. Study the different life forms and their general, appearance, spread, etc., 3. Place each one of the plant under different life, forms as per the classification proposed by, Raunkiaer (1934); as given below, , Calculations, Importance value index (IVI) is a measure of, dominance and ecological success of a species. It, takes into consideration relative dominance,, relative density and relative frequency. These are, calculated as follows10, phanerophytes, , Observations, 1. Record the observations in the following table., 20, , 30, , 40, , r ____-r-_ _ _ _ _ _ _ _ _ _ _ _ _ _ _ _ _ _ _--.../46, , /9, , chamaephytes, , --'~26, , heml-cryptophytes f-- _ _- r _ _ _ _ _ _ _ _ _ _, geophytes, , therophytes, , 6, , 1, ]1 3, , '---------', Pig. 21. Raunkiaer's normal biological spectrum for the world's phancrogamlc flora.
Page 7 :
Ecology, , [ 351, , Table 8. Raunkiaer's classification of life forms, Symbol, , Life form, , P, , I. Phanerophyte, Perennatmg bud well above the ground, These are the further sub-divided mto followmg 1. Megaphanerophyte, PerennatIng bud above 30m high., 2. Mesophanerophyte, ..... between 8 m and 30 m, 3. Mierophanerophyte, .... between 2 m and 8 m, 4. Nanophanerophyte, ... , under 2 m, II. Chamaephyte, Herbaceous or low woody plants whose, perennating buds borne just above ground level, up to 0.3 m., III.lIemicryptophyte, PerennatIng buds close to the ground (rather, half hidden In the sOil)., IV. Cryptophyte, Pcrennating organs below surface or water., These are further sub-divided Into folloWIng1. Geophyte, PerennatIng buds underground., 2. Helophyte, Marsh plants with perennatIng buds in watterlogged mud., 3. Hy~rophyte, PerennatIng buds beneath the water., V.Therophyte, Survival In unfavourable season through seeds, or spores, annuals., , MM, M, N, Ch, , H, , G, , IIH, Th, , Characteristics, , Table 9. To determine biological spectrum., Life, form, class, MM, M, N, Ch, H, G, HH, Th, , No. of individuals, , I, , N-I..I, N-W, N-W, f'N.j, , ti-IJ, , f'N.j, , I, , N-W, Nil, , N-W, N-W, N-W, N-W, f'N.j, , N-W, tH.I, , N-W, N-W, fi..IJ, tH.I, Nil, , III, N-W, N-W, , l'H.J, , N-W, I, , Nil, , f'N.j, , f'N.j, , N-W N-W N-W N-W N-W III, ti-IJ N-W N-W tH.J N-W f'N.j N-W, f'N.j ti-IJ III, N-W Nil H-U Nil Ii-W f'N.j N-W III, N-W, , f'N.j, , 18, 48, 62, 28, 58, 16, , ti-W II, , N-W I, , 20, , 30, , \103, , J214, , heml-cryptophytes, , therophytes, , 47.4%, , 20, , 10.3%, 21.4%, 7.4%, 13.3%, , 270, , 40, , 50, , ~-------r------------------------------~, , geophytes, , 128, , 1474, , phanerophytes, , chamaephytils, , %, , 36, Total no. of individuals observed, , 10, , Total no.in, each class, , r-------'1-7-4------------, \133, L..-_ _ _ _ _----I, , Fig. 22. Biological spectrum for the area studied.
Page 8 :
Practical Botany: Vol 2, , 352 }, 2., , Draw the percentage distribution of different life, forms in it graph on Y-axis and different classes on, , III. THE ENVIRONMENT, , X - axis., , 3., , (1), (2), (3), (4), (5), , Compare this biological spectrum with, Raunkiaer's normal biological spectrum for the, world's phanerogamic flora which shows, phancrophytes 46%, chamaephytes 9%, hemi- cryptophytes 26%, geophytes / or + helophytes and hydrophytes, 6%, therophytes 13%, , Exercise 8, Purpose: To find out reproductive capacity of a, species., Materials, A plant, forceps, petri dishes, filter papers, seeds,, polythene bags, etc., Procedure, The experiment is to be carried out in two slllges., [I] Collection of seeds, 1. Collect as many seeds as possible from a mature, individual of a species., 2. Count the total number of seeds., 3. Repeat the procedure for at least five individuals, of lhe same species., 4. Calculate the average number of seeds per plant (x)., , [II] Germination of seeds, 1. Place a filter paper in a petri dish., 2. Moisten the filter paper with water., 3. Place a few seeds on the filter paper. Take care, that filter paper does not dry. Continue to add, drops of water as and when required., 4. Repeat the experiment by using at least five petri, dishes., 5. Count the number of germinated seeds after a, few days., 6. Calculate the average percentage germination (Y), No. of germinated seeds X 100, Total no. of seeds used, , Calculations, Calculate the reproductive capacity as given, below., Reproductive capacity, Average no. of seeds (x) x Average % germInation (y), 100, , (B-lS), , Exercise 1, Purpose: To study the soil texture., Materials, A pick, polythene bags, hand lens, meshes of, different porc sizes, forceps, etc., Procedure, A soil sample is collected, packed in the, polythene bags and dried in the laboratory. Examine, dry sample by a hand lens and feel it between fingers., Similarly examine a moist sample., The soil can also he placed on meshes of different, pore sizes and the amount of particles which pass, through them are recorded., Observations, (a) Soil can be indentified on the basis of, particles 1. soil particles very large:, Gravel, 2. particles small, apparent to the naked eye, gritty, and non-plastic when wet;, Sand, 3. particles very small, very plastic when wet and, hard when dry., Clay, , (b) Some soils show mixture of various particles 1. soil with an almost equal amount of sand and, clay;, Loam, 2. a mixture of soil particles, with more of sand; ..., Sandy loam, 3. a mixture of soil particles, with more of silt; soil, appears floury or talc-like, plastic when wet;, Silt loam, 4. a mixture of soil particles, with more of clay, soil, very plastic when wet., Gay lo~m, (c) Classification of soil particle-size groups Diameter (in mm), more than, 5.000, Coarse gravel ..., Fine gravel, 0.200, to, 5.000, Coarse sand, 0.020, to, 2.000, Fine sand, 0.002, to, 0.200, Silt, 0.002, to, 0.020, Clay, 0.002, to, less, Soil texture refers to the relative pre portions of, the various size groups of the indvidual particles.
Page 9 :
Ecology, , [ 353, , Exercise 2, Purpose: To measure the soil temperature., Materials, Ordinary or soil thermometer., Procedure, The soil temperature at various depths is, measured by anyone of the two following methods., [I] Ordinary thermometer, , A hole is dug in the soil up to a desired depth by, means of a pointed iron or steel rod. Thermometer, is then placed in this hole for about 15 minutes and, temperature is recorded., [II] Soil thermometer, These thermometers have a steel end near the, mercury bulb. Thermometer is dirGctly pushed into, the soil by steel end to a desired depth and the, temperature is recorded., , Exercise 3, Purpose: To determine the soil pH., Materials, Soil sample, distilled water, pH paper!barium, sulphate/comparometer/ tintometer, pH indicator, etc., Procedure, The following methods are commonly used., [I] pH Paper, , 1. Add a pinch of soil to 5 ml distilled water., 2. Take a broad range pH paper indicator (a small, piece) and dip it in the soil-water suspension., The colour of the paper changes., 3. Match the colour with the colour scale given on, a booklet. This gives an approximate pH value., 4. For more correct value, narrow range pH paper, indicator of the value indicated by broad range, paper is now taken (i.e., if the pervious value, comes to 8, now use indicator of the scale, varying between 7.5 to 8.5)., 5. The colour change is compared with the scale, given on booklet and approximate pH value is, determined., (pH papers are those papers on which indicators, of various pH ranges are absorbed)., , [II] Barium sulphate test, 1. A spoonful of soil is added to an equal amount, of Barium sulphate., 2. About 10-20 ml of distilled water is added to the, test tube containing soil suspension., 3. Now sufficient quantity of soil indicator is ;>dded to, the test tube and contents are thoroughly shaken., 4. Allow the contents to stand., 5. Match the colour developed with the colour chart, and note the pH value., (For this purpose B.D.H. Barium sulphate soil, testing outfit would be very useful)., [III] Comparometers(fintometers., 1. These are boxes with two windows. In one of the, windows of the box, test tube containing, soil-water suspension is kept, while in another,, a tube with standard fiolution is kept (or in, tintometers a rotating colour disc is adjusted), and the comparisons are made., 2. To prepare a soil- water suspension, take a tube, supplied with the apparatus., 3., , Add a little Barium sulphate and almost twice, the amount of soil., 4. Fill the tube up to the mark with distilled water, and shake thoroughly. Allow the tube to stand, till the clear liquid appears., 5. Place the tube in slot of the box and compare the, colours to find out the pH value., , Exercise 4, Purpose: To determine water holding capacity., Materials, Filter papers, brass or tin boxes, balance, soil, sample, petri dishes, water, oven, etc., Procedure, 1. Take a soil sample, allow it to dry and crush it., 2. Take a brass or tin box with perforated bottom and, weigh the box (1)., 3. Take a filter paper and weigh it (2)., 4. Now place a filter paper at the bottom of the box., Fill the box gradually with soil by tapping to, ensure uniform filling., 5. Place such a soil filled box in a petri dish, containing water and allow it to remain, overnight. Weigh the container once again (3)., (B-15)
Page 10 :
354, , I, , 6., , Now place this container in an oven at 105°C for, about 24 hours, till constant weight is attained., Record the weight (4)., Take a few ftlter papers (similar to one used in, container). Dip 'one in water and find out the, average amount of water absorbed by the ftlter, paper., , 7., , Practical Botany: Vol 2, , Results., . Results are computed in the following way., [I] Observations, , Record the observations as follows., 40.75 g, 1. Weight of the box, 0.112g, 2. Weight of dry filter paper, 3. Weight of wet soil + box + wet filter paper, 111.50 g, 4. Weight of,dry soil + box + dry filter paper', 91.50 g, 0.634g, 5. Weight of wet filter paper, [II] Calculations, ., Calculate water holding capacity as follows \, 6. Weight of wet soil, , 7. Weight of oven, dry soil, , (weight of wet soil' + box, + wet filter paper) (weight of box + weight, of wet filter paper)., = (3)-(1+5), = 111.50 g - (40.75 g, + 0.634 g), = 70.12g, =, , = (weight of dry soil + box, , =, =, , + dry filter paper) (weight of box + weight, of dry filter paper)., (4) - (1 +2), 91.50 g - (40.75 g, + 0.112 g), , = 50.64g, 8. Water in soil, , weight of wet soil weight of oven dry soil, = (6)-(7), = 70.12 g - 50.64 g, = 19.48 g, , =, , Water holding capacity, amount of water in the soil (8), weight of oven dry soil(7), =, , =, , X, , 100, , 19.48, 100, 50.64 X, 38.46 %, , Exercise 5, Purpose: To determine. moisture percentage of, soil., Materials, Test tubes, box containers, soil sample, balance,, oven, water, etc., Procedure, The following procedure is used., 1. Collect the soil at desired depth and keep in, closed test tubes or box., 2. Take an empty box or suitable container and, weigh it (1)., 3. Now fill the box with soil and weigh it (2)., 4. Place this container in an oven at 105°C for about, 24 hours till constant weight is attained. Note the, weight after drying (3)., Results, Results can be obtained in the following way [I] Observations, , Record the observations as follows 1. Weight of the box, 2. Weight of the box + soil, 3. Weight of the box + oven dry soil, , 25.0g, 125.0 g, 105.0 g, , [II] Calculations, Calculate the following values 4. Weight of the soil = (weight of box + soil) weight of box, = (2)-(1) = 125g -25g, = 100g, 5. Weight of dry soil = (weight of box + oven dry, soil - weight of box, = (3)-(1) = 105g -25g, = 80g
Page 11 :
Ecology, , [ 355, , 6. Amount of moisture, in the soil, = weight of the soil, weight of dry soil, = (4)-(5) = 100g - 80g, = 20g, Moisture %, amount of moisture in the soil 100, weight of dry soil, X, , Exercise 7, , -0, , = 20, 80, , X, , 100 = 25%, , Exercise 6, Purpose: To find out bulk density of a given soil, sample., Materials, Soil samples, petri dishes, oven, measuring, cylinders, balance etc., , Purpose: To find out the porosity (per cent pore, space) of a given soil sample., Materials, Soil samples, petri dishes, beaker, measuring, cylinders, beakers, balance, etc., Procedure, 1. Scrape the soil surface to flat., 2. Dig straight walled pit (lOX lOx 10 cm)., 3. Collect the removed soil in a beaker., 4. Dry the soil in an oven at 105°C till constant weight, is attained., 5. Transfer a part of this soil to measuring cylinder, and determine the volume (1)., 6. Also determine the weight of soil (2) and then, the weight of measuring cylinder alonef3)., , Procedure, 1. Collect soil samples from different places at a, depth of 15 cm., 2. Dry the soil in an oven at 105°C till constant weight, is attained., 3. Transfer a part of this soil to the measuring, cylinder and determine the volume (1)., 4. Also determine the weight of soil by first weighing, measuring cylinder and the soil (2) and then the, weight of measuring cylinder alone (3)., , Observations and calculations, Record the observations as follows., 7. Volume of the soil (1)., ~. Weight of measuring cylinder + soil (2)., 9. Weight of measuring cylinder (3)., 10. Calculate the bulk density by using following, formula, Bulk density _ weight of the soil (2) - (3), (gml cm3) volume of the soil (1), , Observations and Calculations, Record the observations as follows., 5. Volume of the soil (1), 6. Weight of measuring cylinder + soil (2), 7. Weight of measuring cylinder (3), Calculate by using following formula, Bulk density _ Weight of soil (gm) _ (2) - (3), (gml cm3) volume of soil, (1), , Where 2.6 is the approximate specific gravity of, soil., , 8. Place the soil in one of the three following, classes, Soil classes, Bulk density (gm/cm3), (a) Medium to fine textured, 1.1 - 1.5, 1.2 - 1.65, (b) Coarse textured, 1.70 -1.85, (c) Alkaline saline, The bulk density is defined as dry weight of unit, volume of soil (in gm/cm3). It is inversely, proportional to pore space of the soil., , 11. Now calculate percentage pore space by the, formula given below., 2.6 - Bulk density, Per cent pore space =, 2.6, X 100, , Exercise 8, Purpose : Demonstration of different horizons, of local soil profile., Materials, Pick, trowel, etc., Procedure, 1. Dig a long trench of 75 cm wide and 1.5 m deep, in an undisturbed area. (e.g. college campus), (A narrow pit, dug in the study area of the college, will alsu serve the purpose of demonstration).
Page 12 :
356 J, , Practical Botany: Vol 2, , Table 10. Characters of different horizons., Horizon, , A, , 8, , C, , -, , Sub horizon, , Depth (em), , Profile characters, , Aoo, , 0-2, , Uppermost layer, with freshly fallen organic matter such as dead leaves,, branches, flowers, fruits, etc., , Ao, , 2-15, , Organic matter in different stages of decomposition mostly partially decomposed, and called duff., , AI, , 15 - 25, , Dark, rich in organic matter, often mixed with mineral particles., , A2, , 25-45, , Lighter in colour with mineral particles of large size and little amount of, organic matter., , 81, , 45-60, , Zone of maximum leaching, humified organic matter present, particles, coarse and colour tlark., , 82, , 60-62, , Rich in clay - sesq uioxides or silicate, clays mineral particles bonded by iron., , 83, , 62-90, , C..ontains sand, stones and gravel, light yellow in colour,, , -, , below 90, , Consists of incompletely weathered, large masses of rocks., , Observations, 1. The trench or a pit shows three horizons - A,B, and C starting with upper surface downwards., 2. The horizons show following characters (table 8)., , Exercise 9, rurpose : Test for the presence of carbonate,, nitrate and deficiency of replaceable bases., Materials, Hydrochloric acid, diphenylamine, sulphuric, acid, ammonium thiocyanate, hydrogen peroxide,, water, white glazed tiles, test tubes, soil samples, etc., Procedure, Following are the methods for determination of, contents of carbonate, nitrate and replaceable bases., [I] Carbonate contents, , It can be determined in the field by adding conc., HCi to the soil sample. This produces effervelicence, which indicates the presence of carbonate in the, soil. If two samples are analysed, degree of, effervescence is compared. More is the effervescence,, more would be the carbonate contents., , [II] Nitrate contents, Prepare 1: 5 soil water suspension. Shake it, thoroughly. Add diphenylamine [prepared in conc., H2S04 (0.2%)] to the clear solution. Take a few, drops of soil suspension on a white tile and add a few, , drops of diphenylamme. Blue colour developed, indicates the presence of nitrate. If two samples are, to be compared, the comparison of depth of blue, colour indicates the degree of nitrate contents., Darker the blue colour is, more would be the nitrate, contents., (For good results, use soil rich in organic, contents, since these are generally rich in nitrate, contents as well)., [III] Deficiency of replaceable bases, (Ca, K, Mg, Na, etc.), Take a pinch of soil and add it to a saturated, alcoholic solution of ammonium thiocyanate. Shake, the contents thoroughly. Allow the solids to settle, down and a clear liquid is available. Now add a drop, or two of H202 and note the red colour which, develops. The degree of colour depth indicates the, deficiency of replaceable bases., , Exercise 10, Purpose: Test for the presence of inorganic salts, in the soil., Materials, Test tubes, beaker, soil, conical flask, distilled, water, barium chloride solution, hydrochloric acid,, sulphuric acid, nitric acid, ammonium nitrate,, ammonium molybdate, silver nitrate, etc.
Page 13 :
[ 357, , Ecology, Procedure, Take about 200 g of soil sample in a conical flask., Add 500 rol distilled water to the conical flask and, shake vigorously. Keep the flask overnight so that, soluble salts dissolve in water. Pour the water slowly, and collect the filtrate (henceforth called water, extract)., [I] Chloride, , Take 20 rol of water extract of the soil in a beaker., Add 10 ml N/IO, H2S04 and thus neutralise, carbonate and bicarbonate present in the extract., Now add silver nitrate to the solution., A white precipitate develops to indicate the, presence of chloride., [II] Sulphate, Take 20 ml of water extract of the soil in a beaker., Add 2-5 ml of conc. HCl and boil. Add BaCl2, solution to the beaker., A white precipitate develops to indicate the, presence of sulphate., [III] Phosphate, Take 10 ml of water extract of the soil. Add a few, drops of ammonium molybdate solution, conc., HN03 and NH4N03., A yellow colour develops to indicate the, presence of phosphates., , Exercise 11, Purpose : Demonstration of C02, 02, chlorine, and ammonia in water., Materials, Lime water, nitric oxide, alkaline pyragallate, solution, ammoniacal cuprous chloride, iodide paper, (paper soaked in potassium iodide solution and starch, solution), Hydrochloric acid, glass rod, Nessler's, solution, test tubes, water, pH indicator papers, etc., Procedure and results, [I] Carbon dioxide, , Take water sample and add to it freshly prepared, lime water. Lime water turns milky. The degree of, milky white colour indicates the amount of carbon, dioxide. Clear lime water turns milky due to the, formation of insoluble calcium., , [II] Chlorine, The presence of chlorine can be dectected in, water sample by dipping starch-iodide paper which, turns blue., [III] Ammonia, The presence of ammonia in water can be, demonstrated by anyone of the following tests., 1. A glass rod dipped in concentrated hydrochloric, acid is inserted in the test tube containing water, sample.. Dense white fumes of ammonium, chloride are produced., 2. The sample turns brown on addition of Nessler's, solution (Nessler' solution is prepared by pouring, potassium iodide in mercuric chloride solution, until the precipitate of mercuric iodide formed, dissolves in excess of potassium iodide. The, solution is then made alkaline with caustic potash.), , Exercise 12, Purpose : Determination of maximum and, minimum temperature., Materials, Maximum and minimum thermometer, etc., Procedure, The thermometer consists ofU-shaped tube, with, bul\J at each end. The bulbs are fIlled wit'h alcohol and, the glass tube with mercury. Inside each limb of the, glass tube, there is an iron indicator (index)., As the temperature rises, the alcohol in the right, hand limb of the glass tube expands and pushes the, mercury down the right hand limb and up the left, hand limb. The movement continues till the highest, temperature is reached. The lower end of the, indicator in the lift hand limb of the glass tube gives, the maximum temperature., When the temperature decreases, the alcohol in, the glass tube contracts and the mercury moves up in, the right hand limb of the glass tube. This causes the, indicator of the right hand limb to move up. The, position of the lower end of the indicator in the right, hand limb indicates the minimum temperature, during the day., After noting the mimmum and maximum, temperature during the day, the iron indicators are
Page 14 :
Practical Botany: Vol 2, maximum minimum, , 'C, , 20, , 30, 40, -1, , 50, , -2, , 60, , Fig. 23. Maximum and minimum thermometer., , brought down in contact with mercury by means of, magnet. This is known as the setting of thermometers., , Exercise 13, , Fig. 24. Dry and wet bulb thermometer (hygrometer)., , Table 1l.,Showing Relative Humidity (in %) in the, atmosphere ., - ..., , Purpose: Determination of relative humidity., Materials, Wet and dry bulb thermometers (hygrometer)., Procedure, These are two identical thermometers, mounted, together. The bulb of one thermometer is exposed to, the air while that of another is covered with a piece, of muslin cloth kept constantly moist by a wick, dipping into a small container filled with water., The dry bulb thermometer indicates the actual, air temperature. The temperature of wet bulb, thermometer is low because of evaporation of, water. When the air is saturated, there is no, evaporation and both the thermometers show the, same temperature. When the air is dry, there would, be rapid evaporation and the temperature in the wet, bulb thermometer would be lowered. The difference, in the temperature indicated by these two, thermometers is used to determine relative humidity, of the air. The following table is used., , _-----, , Temperature, reading of, dry bulb, thermometer 1, 40, 35, 30, 25, 20, 15, 10, 8, 6, 4, 2, 0, 2, ..., , 93, 93, 92, 92, , 91, , 90, 88, 87, 86, 85, 84, 82, 80, , ..., , Difference in temperature-m two, thermometers (in °C), 2, , 3, , 4, , 5, , 6, , 7, , 8, , 9, , 10, , 87, 87, 86, 84, 83, 80, 76, 75, 73, 70, 68, 65, 61, , 82, 81, 79, 77, 74, 71, 65, 63, 60, 56, 52, 48, 42, , 76, 75, 73, 70, 66, 61, 54, 51, 47, 42, 37, , 71, 69, 67, 63, 59, 52, , 66, , 61, 58, 55, 50, , 52, 53, 50, 44, 37, , 52, 49, 44, 38, , 47, , 44, , 44, , 34, , ', , ... .......•, , '...., , 64, , 61, 57, 51, , 44, , 44, , 39, , 35, , 40, 35, , .1......., , ._----, , Suppose that the temperature readmgs of dry and wet, thermometers are 35°C and 30°C respectively. The difference, between the two is 5°C, Now find out the value of relative, humidity given in column showing 5°C difference, placed against, 3SOe temperature of dry bulb thermometer. This comes out to, be 69 percent., , .1
Page 15 :
Ecology, , [ 359, , Exercise 14, Purpose: Soil testing for phosphorus., Materials, Polythene bottles, beakers, glass vials, measuring, cylinders, conical flasks, spot plates, etc. Glacial, acetic acid, ammonia, ammonium molybdate,, concentrated hydrochloric acid, stannous chloride,, stannous oxalate, distilled water, etc., Pr-e£edure, , Results, Light yellow to dark blue colour develops., Conclusions, On the basis of intensity of colour following, inferences can be drawn., 1. Very pale yellow - very low phosphorus., 2. Green or bluish green - medium phosphorus., 3. Light blue - medium phosphorus., 4. Medium blue - adequate phosphorus., 5. Dark blue - abundant phosphorus., , [I] Preparation of soil extract, , 1., , 2., , 3., , 4., 5., , Prepare 2.5% acetic acid extractant by diluting, 25 ml glacial acetic acid to 11 with distilled, water., Prepare ammonium acetate extractant by adding, 57.5 ml glacial acetic acid and 74.0 m1 ammonia, solution (sp. gr. 0.880) to 30 ml of distilled water in, 11 volumetric flask Mix well. Dilute to the mark., Place 19 of air-dry sieved mineral :;oil in a 50 ml, conical flask. Add 25 ml ammonium acetate, extractant prepared earlier and shake for 30, minutes., Filter into polythene bottles, rejecting the first 5, ml of filtrate., Adjust pH to 3.3 with-rlrops of acetic acid or, ammonia., , [II] Preparation of reagents, 6. Dissolve 8 g of ammonium molybdate in 200 ml, distilled water., 7. Prepare a mixture of 126 ml concentrated HCI, and 74 ml distilled water., 8. Add this mixture to ammonium molybdate, solution. Just before use, dilute 1 part of this, reagent with 4 parts distilled water., [III] The method, 9. Mark 10 mllevel in a glass vial. Fill the vial with, reagent., 10. Add 1 level teaspoon of soil extract., 11. Shake the vial vigorously., 12. Filter the solution., 13. To 5 ml of filtrate add 0.1 ml of reagent., 14. Mix by rotation to make sure that sufficient, amount of reagent is added., 15. Add stannous chloride or stannous oxalate, powder till colour becomes intense., , Exercise 15', Purpose: Soil testing for J.»otassium., Materials, Polythene bottles, beakers, glass vials, conical, flasks, measuring cylinders, conical flasks, _spot, plates, etc., ., Ammonia (sp. gr. 0.880), glacial acetic acid,, sodium cobalt nitrite, sodium nitrite, anhydrous, isopropyl alcohol, distilled water,, Procedure, [I] Preparation of soil extract, 1. Prepare ammonium acetate extractant by adding, 60 ml glacial acetic acid and 74.0 ml ammonia, solution (sp. gr. 0.880) to 20-30 m1 of distilled, water in 11 volumetric flask. Mix well. Dilute to, the mark., 2. Place 1 g of air-dry dieved mineral soil in a 50 rnl, conical flask., 3. Add 25 ml of ammonium acetate extractant and, shake for 30 minutes., 4. Filter into polythene bottles, rejecting the first 5, ml of filtrate, 5. Adjust pH to 7.00 with drops of acetic acid or, ammonia., [II] Preparation of reagents, 6. Dissolve 5 g of sodium cobalt nitrite, (Na3CO(N02)6 and 30 g of sodium nitrite, (NaN02) in 80 ml distilled water., 7. Add 50 ml glacial acetic acid and make up the, volume to 100 ml. Allow to stand for several, days., 8. Just before use, add 5 ml of the reagent to a, solution of 15 g NaN02 in 100 ml distilled, water. Adjust pH to 5.0 with acetic acid.
Page 16 :
Practical Botany,' Vol 2, , 360 -', , [III] The method, 9. Mark 10 ml level in a glass vial. Fill upto mark, with reagent., 10. Add 1 level teaspoon of air-dried soil. Shake, vigorously for 1 minute., 11. Filter to 5 ml of fIltrate add 2.5 ml of reagent., 12. Add anhydrous isopropyl alcohol. Mix, thoroughly and let it stand for 3 minutes., Results, Thrbidity is developed., Conclusions, On the basis of degree of turbidity following, conclusions can be drawn., 1. Trace of turbidity - deficient potassium supply., 2. Medium turbidity - doubtful potassium supply, 3. Very high turbidity - adequate potassium supply., , Exercise 16, Purpose: Soil testing for Nitrate., Materials, Soil sample, polythene bottles, pipette,burette,, beakers, measuring cylinder, centrifuge, fIlter, papers tWhatman no. 1), white spot plate, test tube,, balance, etc., Sodium chloride, diphenylamine,, sulphuric acid,water, etc., Procedure, 1. Dig out a small amount of soil. Place about 25, g of this sample in polythene bottle., 2. Add 200 ml of 6% NaCI (propared by dissolving, 6 g of NaCI in 100 ml of water), 3. Close the bottle tightly and shake it for 30, minutes. Allow this bottle to stand for about 30, minutes., 4. Pipette out about 100 ml of the suspension and, distil to get clear extract. This can also be done, by filtering soil suspension through Whatman, no. 1 filter paper., 5. Prepare diphenylamine by dissolving 0.05 gin 25, ml of concentrated H2S04., 6. Place one drop of soil extract on a spot plate., Add four drops of diphenylamine. Let it stand, for 2 minutes., 7. Blue colour develops., Result, 1. Blue colour that develops indicates presence of, nitrate., , 2. If colour is deep blue - nitrate content is high., 3. If. colour is pale blue - nitrate content is low., , Exer::ise 17, Purpose, Comparison of dissolved oxygen, content of polluted and non-polluted water by, iodometric titration method., Materials, Manganous chloride (40% solution); a mixture, of sodium hydroxide (33g) and potassium iodide, (lag) dissolved in 100 ml of distilled water; standard, sodium thiosulphate solution (N/4O; i.e. 0.62 g of, sodi\lm thiosulphate dissolved in 100 mI· of distilled, water); concentrated sulphuric acid; starch solu(ion;, distilled water., Burette, pipette, beakers, sampling bottles,, measuring cylinders, etc., Procedure, 1. Take a narrow mouthed reagent bottle of about, 250 ml capacity with a tight fitting ground glass, stopper. Fill the water to be sampled in such a, way that there is no bubbling. Allow plenty of, water to overflow in the sample bottle., 2. Remove carefully the stopper of the sample, bottle. Add 0.5 ml of manganous chloride and, 0.1 ml of mixture of NaOH and KI for every 70, ml of sample. Use proportionately larger, volumes of the two solutions for more quantity, of samples., 3. Close the bottles firmly. Care should be taken to, see that no air bubbles are included. Shake well, and leave to stand for five minutes. A brown, precipitate of manganic hydroxide appears and, the oxygen in the sample is now fIXed. This, procedure can be easily carried out in the field, and the remaining stages are completed in the, laboratory., 4. Add 2 ml of concentrated sulphuric acid to the, sample as above. Mix the contents thoroughly, by rotation. The precipitate disappears. The, liquid becomes clear golden brown in colour, due to liberation of iodine., 5. Take about 25 ml of treated sample in a pipette,, transfer it to conical flask and immediately, titrate against standard sodium thiosulphate, solution, using 2 ml of starch solution as indicator., 6. Starch is added until the yellow of iodine has, nearly disappeared.
Page 17 :
[ 361, , Ecology, 7., , The procedure should be repeated at least twice, for each sample., , Calculations1. ml of the standard sodium thiosulphate, equivalent to 0.1 mg of oxygen., Let VI be the volume of thiosulphate used, V2 be the volume of sample, V 1 xO.1XlOOO, mg oxygen per litre, , IS, , Now 1 ml of sodium thiosulphate, = 0.0001 g of oxygen, Therefore, 1 ml of sodium thiosulphate, 0.0001 X22.400, f0, 32, mg 0 2, Hence, VIXO.0001X22.40~~1000, =, , mg of oxygen per litre, , = V 1 x70
