Page 1 :
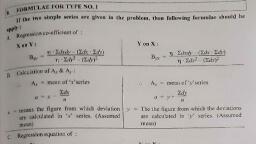
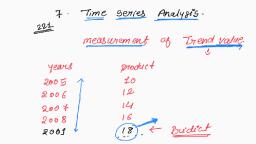
aR VARIOUS METHOD, <T SQUARE METHOD, ERAGE METHOD, NG AVERAGE METHOD., , QUARE METHOD (TREND LINE METHOD), , int:, wre a table of six columns., , , , , , , , , , , , , , , . ne, : middle year middle year = "++, , St, , ,, , jeulate of Average : (Mean) a = 2, , , , , te of growth : <5, , | Line = Year — (T.D. x R.G.) = Product + Average Product, ion of production of required year :, , , , 1979 1980 1981 1982, 72 75 65 80, , on for the 1987., ion & short term oscillations —
Page 2 :
Trend Line | Shor. t.~, (Yo) yes, ¢, , , , , , re, , 182, , , , , , , , Solution :, , Tqime Devi. From |, middle year *, , , , | Year, , , , Working : 4, Rateo £ Growth, 1. Middle Year _ by, =e 1 = 136, , = 28, = 4" year from top. i, , 4. Trend Line: a~ (T.D. x R.G.), , 2. Mean, 1978 =(-3 x 4.86) = -14.58+ 76 = 61.42, , a, ae 1979 = (-2 x 4.86)= -9.72+ 76 = 66.28, oo 1980 = (-1 x 4.86)= 4.86+76 = 71.14, 7 1981 = (0 x 4.86) = 0+76 = 76.00, = 76 1982 = (1 x 4.86) =+ 4.86+76 = 80.86, , 1983 = (2 x 4.86) =+9.72+76 = 85.72, 1984 = (3 x 4.86) =+14.58 + 76 = 90.58, , , , 5. Production for the year 1987, Production = a+ (R.Y.-M. Y.) x R.G., = 76 + (1987 — 1981) x 4.86, = 76 - (6 = 4.86), = 76+ 29.16, = 105.16, Answer :, 1. Trend Line: 61.42. 66.28, 71.14, 76, 80.86, 85.72, 90.58, Production for the year 1987 = 105.16, Short term fluctuation and short term oscillation = -1.42, 5.72, 3.86, -11, -.86, -.72, 4.42, Z(Y-Ye)=0, LY = ZYc, 532 = $32, , we wn
Page 3 :
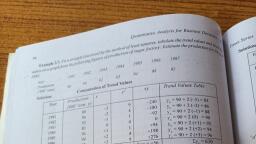
oe the figures of production of a factory :, 1982 1983 1984, , , , , , , , , , , , , , , , , , , , , , , , , , , , , , , , , , , , , , , , , , , , , , are, below 1978 +1979 +«=«1980 «1983, — YesT snousands tones 80 90 92 83 94 99 92, 3 rede exight-l ne trend to these figures., AY B. Hie figures on 4 graph and show the trend line., i) Pio!, Time Devi. From Trend Line, 2, middle year x xy = (Yo 4, 3 -240 9 84 |, -2 -180 4 86, -1 -92. 1 88, 0 0 0 90, 1 94 1 92, 2 198 4 94, 3 276 9 96, Dr=0 Diy = 56 Dx? = 28 TY, = 630, 3. Rate of Growth, 29, = a, _ 36, 728, = 4" year from top. 25, 4. Trend line: a+ (T-D. x R.G.), 1978 = (-3x2) = -6+90 =34, , , , 979 = (-2*2) =, , , , yy the method of least, What would be the predi ate, 1979 1980 1981, , 38 co 108 ae, , straight line trend b, ‘change continues.
Page 4 :
ia4, , Solution :, , Year, , , , , , , , , , , , , , 1978, , 979, 1980, 1981, 1982, 1983, 1984, 1985, , Working Note :, 1. Middle Year, ats, as, ott, 2, ~ 4,5" year from top., = 4” = 1981, « 5” = 1982, , 1981 ‘ 1982. ions, , 2. Mean, , a, a, , L), , 2 alg =e, , 5. Production for the year 1987, , Production = a+(R.Y.—M. Y.)* R.G., 67 + (1987 — 1981.5) * 3.73, 67 + (5.5 x 2) * 3.73, , 67 + 11 * 3.73, 67 + 41.03, 108.03, , , , , , e, , 626, 168, , = 3,73, Trend Line: a+ (1.D. x RG.), , 1978 = (-7 * 3.73) = -26.11 + 67, 1979 = (-5 * 3.73) -18.65 +67, {980 = (-3 * 3.73) = -11.19 + 67, (O81 = (C1 * 3.73) = -3.73 + 67, 1982 = (1 x 3.73) = 3.73 + 67, , 1983 = (3 x 3.73) = 11.19 + 67, , x2 Trend Lie, Z 0, , a9 40.89, , 25 48.35, , 9 55.8), , \ 63.27, , | 70.73, , 9 78.19, , 25 85.65, , 49 93.14, , Ex? = 168 aN = Siem, —, , 40.89, 48.35, 55.8], , = 63.27, = 10.73, = 78.19, 1984 = (5 x 3.73) = 18.65 + 67 =, , 85.65, , 1985 = (7 * 3.73) = 26.11 +67 =931), , Answer: 1. Trend line : 40.89, 48.35, 55.81, 63.27, 70.73, 78.19, 85.65, 93.11, 2. Production for the year 1987 = 108.03
Page 5 :
Jine trend by the method of least squares to the following data :, , , , , , Production of TV Year Production of TV, , (sets ‘000) (sets 000), 17 1981 35:, 20 1982 55, 19 1983 50, 26 1984 TA, 24 1985 69, 40, , te the production for the year 1990., , , , , , , , , , , , production Y tle alas xy x2 Trend Line (Yc), 4 7 Z “85 25 10, & 20 4 -80 16 15.8, : 19 3 57 9 21.6, 2 52 4 274, et 24 1 33.2, 0 0 0 39, 1 35 | 44.8, 2 110 4 50.6, 3 150 9 56.4, 296 16 62.2, 68
