Page 1 :
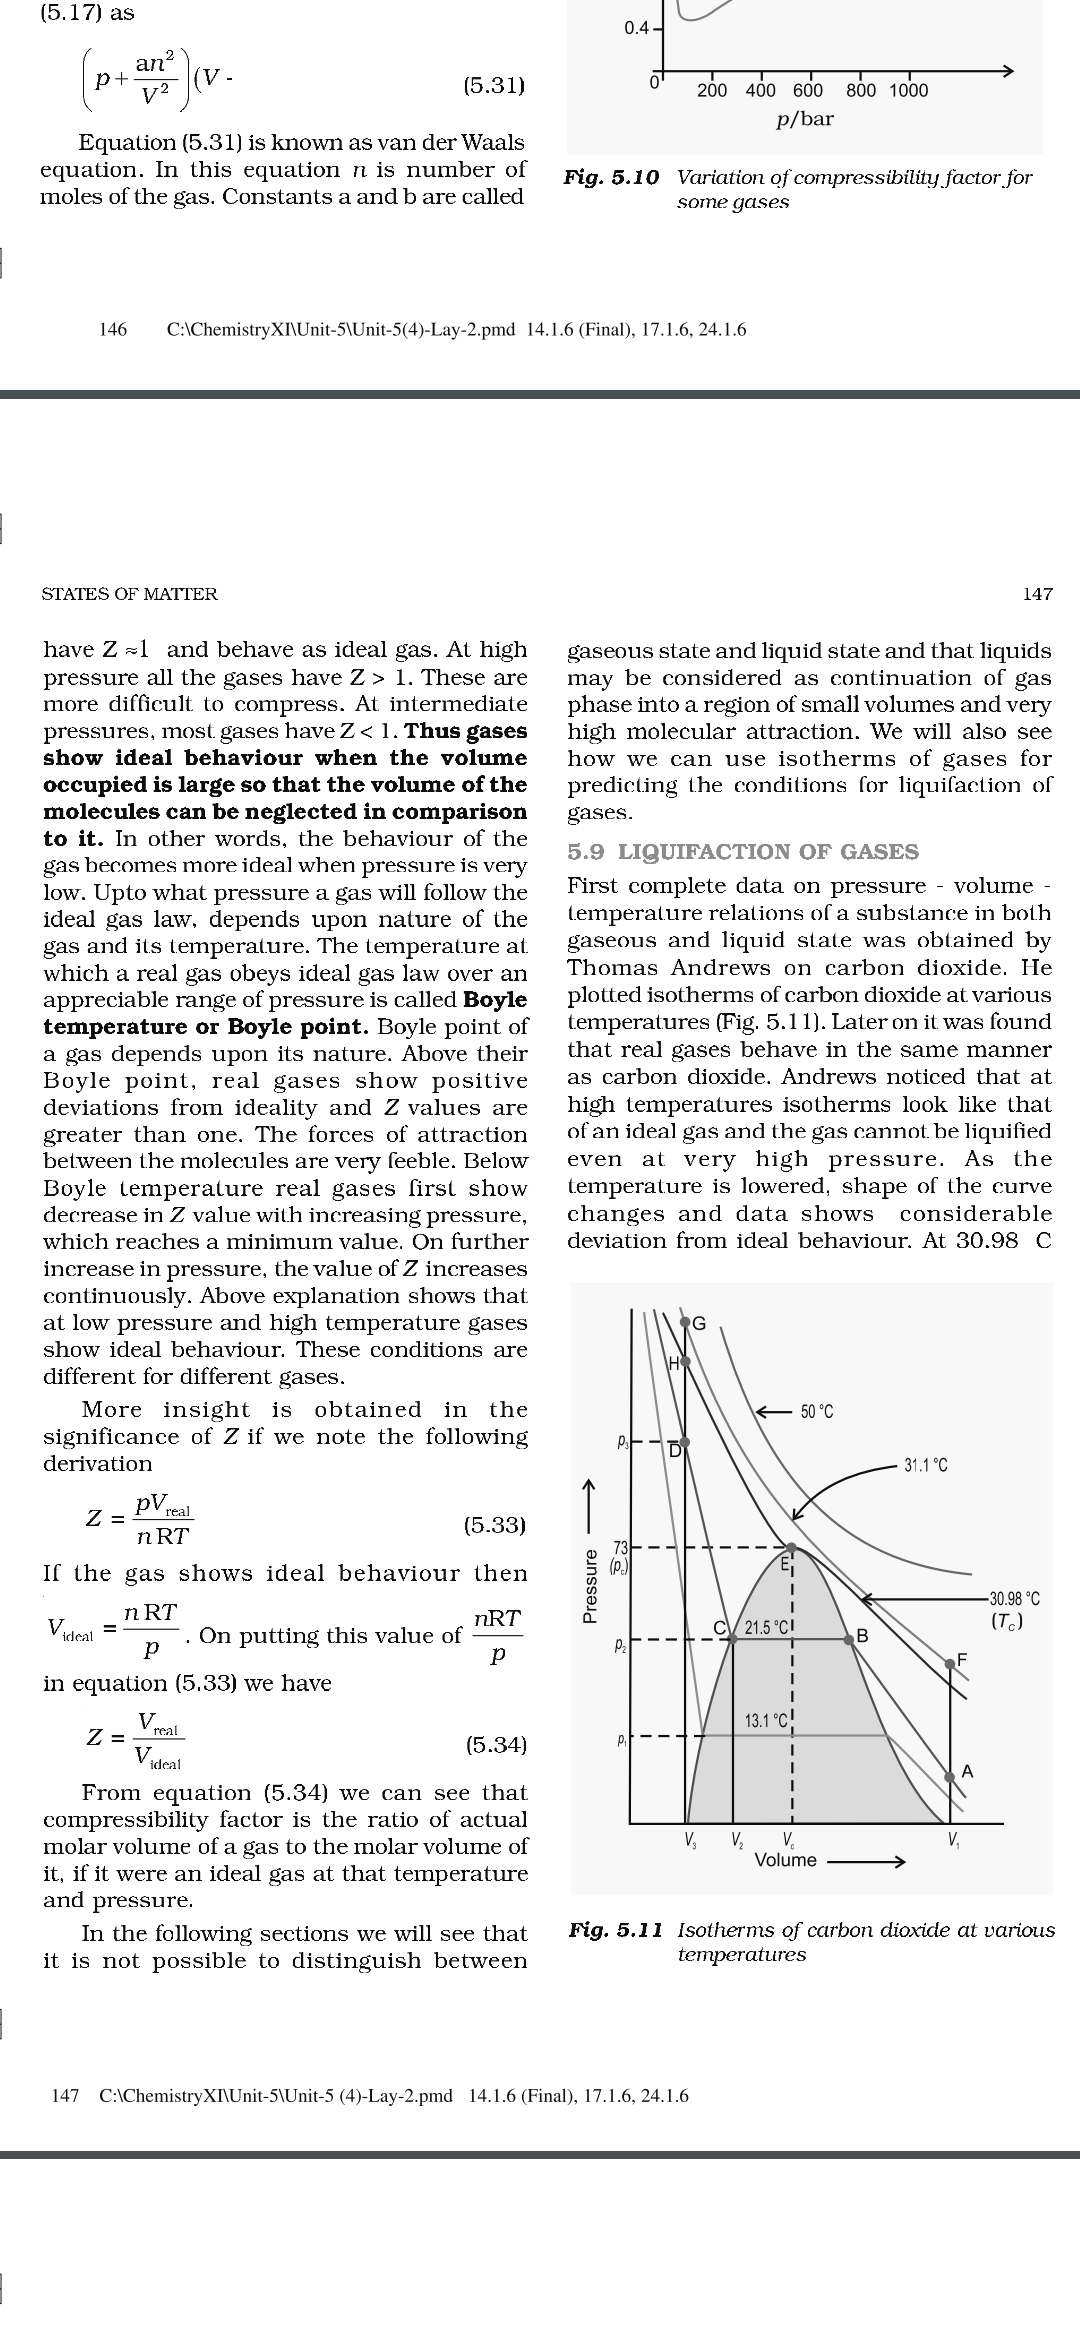
(5.17) as, , 2, an, [ pt 2 \w Equation (5.31) is known as van der Waals, , equation. In this equation n is number of, moles of the gas. Constants a and b are called, , , , (5.31), , 0.4, , 9 200 400 600 800 1000, p/bar, , Fig. 5.10 Variation of compressibility factor for, some gases, , 146 C:\ChemistryX]\Unit-S\Unit-5(4)-Lay-2.pmd_ 14.1.6 (Final), 17.1.6, 24.1.6, , STATES OF MATTER, , have Z =1 and behave as ideal gas. At high, pressure all the gases have Z > 1. These are, more difficult. to compress. At intermediate, pressures, most gases have Z < 1. Thus gases, show ideal behaviour when the volume, occupied is large so that the volume of the, molecules can be neglected in comparison, to it. In other words, the behaviour of the, gas becomes more ideal when pressure is very, low. Upto what pressure a gas will follow the, ideal gas law, depends upon nature of the, gas and its temperature. The temperature at, which a real gas obeys ideal gas law over an, appreciable range of pressure is called Boyle, temperature or Boyle point. Boyle point of, a gas depends upon its nature. Above their, Boyle point, real gases show positive, deviations from ideality and Z values are, greater than one. The forces of attraction, between the molecules are very feeble. Below, Boyle temperature real gases first show, decrease in Z value with increasing pressure,, which reaches a minimum value. On further, increase in pressure, the value of Z increases, continuously. Above explanation shows that, at low pressure and high temperature gases, show ideal behaviour. These conditions are, different for different gases., , More insight is obtained in the, significance of Z if we note the following, derivation, , = PV rai, , nRT, If the gas shows ideal behaviour then, , (5.33), , Vere = ORE me thi nRT, ideal = Dp” On putting this value of, , , , in equation (5,33) we have, , Vea, Zee (5.34), , ideal, , From equation (5.34) we can see that, compressibility factor is the ratio of actual, molar volume of a gas to the molar volume of, it, if it were an ideal gas at that temperature, and pressure., , In the following sections we will see that, it is not possible to distinguish between, , 147, , gaseous state and liquid state and that liquids, may be considered as continuation of gas, phase into a region of small volumes and very, high molecular attraction. We will also see, how we can use isotherms of gases for, predicting the conditions for liquifaction of, gases., , 5.9 LIQUIFACTION OF GASES, , First complete data on pressure - volume temperature relations of a subsiance in both, gaseous and liquid state was obtained by, Thomas Andrews on carbon dioxide. He, plotted isotherms of carbon dioxide at various, temperatures (Fig. 5.11). Later on it was found, that real gases behave in the same manner, as carbon dioxide. Andrews noticed that at, high temperatures isotherms look like that, of an ideal gas and the gas cannot be liquified, even at very high pressure. As the, temperature is lowered, shape of the curve, changes and data shows considerable, deviation from ideal behaviour. At 30.98 C, , a, , Pressure ——>, , , , YM, Vv, vy,, Volume ————>, , Fig. 5.11 Isotherms of carbon dioxide at various, temperatures, , 147 C:\ChemistryXI\Unit-5\Unit-5 (4)-Lay-2.pmd_ 14.1.6 (Final), 17.1.6, 24.1.6
