Page 1 :
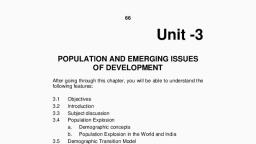
Unit I, Chapter 1, , POPULATION, Distribution, Density, Growth, and Composition, , The people are very important component of a, country. India is the second most populous, country after China in the world with its total, population of 1,028 million (2001). India’s, population is larger than the total population, of North America, South America and Australia, put together. More often, it is argued that such, a large population invariably puts pressure, on its limited resources and is also responsible, for many socio-economic problems in the, country., , How do you perceive the idea of India? Is, it simply a territory? Does this signify an, amalgam of people? Is it a territory, inhabited by people living under certain, institutions of governance?, , In this chapter, we will discuss the, patterns of distribution, density, growth and, composition of India’s population., , Sources of Population Data, Population data are collected through, Census operation held every 10 years in our, country. The first population Census in India, was conducted in 1872 but its first complete, Census was conducted only in 1881., , Distrib, ution of P, opula, tion, Distribution, Popula, opulation, Examine Fig. 1.1 and try to describe the, patterns of spatial distribution of population, shown on it. It is clear that India has a highly, uneven pattern of population distribution. The, percentage shares of population of the states, and Union Territories in the country (Appendix –, iA) show that Uttar Pradesh has the highest, population followed by Maharashtra, Bihar and, West Bengal., , Looking at the data in Appendix (i) and iA arrange the, Indian states and union territories according to their, sizes and population and find out :, , 2015-16
Page 2 :
Fig. 1.1 : India – Distribution of Population, , 2, , India : People and Economy, , 2015-16
Page 3 :
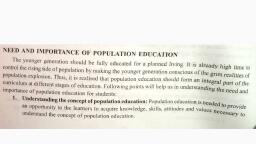
States/UTs of large size and large population, States/UTs of large size but small population, States/UTs of smaller size but larger population, , Check from the table (Appendix–iA) that U.P.,, Maharashtra, Bihar, West Bengal, Andhra, Pradesh along with Tamil Nadu, Madhya, Pradesh, Rajasthan, Karnataka and Gujarat,, together account for about 76 per cent of the, total population of the country. On the other, hand, share of population is very small in the, states like Jammu & Kashmir (1.04%),, Arunachal Pradesh (0.11%) and Uttarakhand, (0.84%) inspite of theses states having fairly, large geographical area., Such an uneven spatial distribution of, population in India suggests a close relationship, between population and physical, socioeconomic and historical factors. As far as the, physical factors are concerned, it is clear that, climate along with terrain and availability of, water largely determines the pattern of the, population distribution. Consequently, we, observe that the North Indian Plains, deltas and, Coastal Plains have higher proportion of, population than the interior districts of southern, and central Indian States, Himalayas, some of, the north eastern and the western states., However, development of irrigation (Rajasthan),, availability of mineral and energy resources, (Jharkhand) and development of transport, network (Peninsular States) have resulted in, moderate to high concentration of population, in areas which were previously very thinly, populated., Among the socio-economic and historical, factors of distribution of population, important, ones are evolution of settled agriculture and, agricultural development; pattern of human, settlement; development of transport network,, industrialisation and urbanisation. It is, observed that the regions falling in the river, plains and coastal areas of India have remained, the regions of larger population concentration., Even though the uses of natural resources like, land and water in these regions have shown, the sign of degradation, the concentration of, population remains high because of an early, , history of human settlement and development, of transport network. On the other hand, the, urban regions of Delhi, Mumbai, Kolkata,, Bangalore, Pune, Ahmedabad, Chennai and, Jaipur have high concentration of population, due to industrial development and, urbanisation drawing a large numbers of, rural-urban migrants., , Density of P, opula, tion, Popula, opulation, Density of population, is expressed as number, of persons per unit area. It helps in getting a, better understanding of the spatial distribution, of population in relation to land. The density of, population in India (2011) is 382 persons per, sq km. There has been a steady increase of more, than 200 persons per sq km over the last 50, years as the density of population increased, from 117 persons/ sq km in 1951 to 382, persons/sq km in 2011., The data shown in Appendix (i)A give an, idea of spatial variation of population densities, in the country which ranges from as low as 17, persons per sq km in Arunachal Pradesh to, 11,320 persons in the National Capital Territory, of Delhi. Among the northern Indian States,, Bihar (1106), West Bengal (1028) and and Uttar, Pradesh (829) have higher densities, while, Kerala (860) and Tamil Nadu (555) have higher, densities among the peninsular Indian states., States like Assam, Gujarat, Andhra Pradesh,, Haryana, Jharkhand, Odisha have moderate, densities. The hill states of the Himalayan region, and North eastern states of India (excluding, Assam) have relatively low densities while the, Union Territories (excluding Andaman and, Nicobar islands) have very high densities of, population (Appendix–iA)., The density of population, as discussed, in the earlier paragraph, is a crude measure, of human and land relationship. To get a better, insight into the human-land ratio in terms of, pressure of population on total cultivable land,, the physiological and the agricultural densities, should be found out which are significant for, a country like India having a large agricultural, population., , Population: Distribution, Density, Growth and Composition, , 3, , 2015-16
Page 4 :
Fig. 1.2 : India – Density of Population, Activity: Construct a choropleth map to represent Density of population in India-2011 based on data given in, Appendix– iA and compare that with the above map., , 4, , India : People and Economy, , 2015-16
Page 5 :
Physiological density = total population /, net cultivated area, Agricultural density = total agricultural, population / net cultivable area, Agricultural population includes cultivators, and agricultural labourers and their family, members., , With the help of data given in Appendix (ii), Calculate, the Physiological and Agricultural densities of, population of Indian States and Union Territories., Compare them with density of population and see how, are these different?, , G rrowth, owth of P, opula, tion, Popula, opulation, Growth of population is the change in the, number of people living in a particular area, between two points of time. Its rate is expressed, in percentage. Population growth has two, components namely; natural and induced., While the natural growth is analysed by, , assessing the crude birth and death rates, the, induced components are explained by the, volume of inward and outward movement of, people in any given area. However, in the, present chapter, we will only discuss the, natural growth of India’s population., The decadal and annual growth rates of, population in India are both very high and, steadily increasing over time. The annual, growth rate of India’s population is 1.64 per, cent (2011)., , Population Doubling Time, Population doubling time is the time taken, by any population to double itself at its, current annual growth rate., , The growth rate of population in India over, the last one century has been caused by annual, birth rate and death rate and rate of migration, and thereby shows different trends. There are, four distinct phases of growth identified within, this period:, , Table 1.1 : Decadal Growth Rates in India, 1901-2001, Census, , Total Population, , Years, , Growth Rate*, Absolute Number, , % of Growth, , 1901, , 238396327, , ------------, , ------------, , 1911, , 252093390, , (+) 13697063, , (+) 5.75, , 1921, , 251321213, , (-) 772117, , (-) 0.31, , 1931, , 278977238, , (+) 27656025, , (+) 11.60, , 1941, , 318660580, , (+) 39683342, , (+) 14.22, , 1951, , 361088090, , (+) 42420485, , (+) 13.31, , 1961, , 439234771, , (+) 77682873, , (+) 21.51, , 1971, , 548159652, , (+) 108924881, , (+) 24.80, , 1981, , 683329097, , (+) 135169445, , (+) 24.66, , 1991, , 846302688, , (+) 162973591, , (+) 23.85, , 2001, , 1028610328, , (+) 182307640, , (+) 21.54, , 2011**, , 1210193422, , (+) 181583094, , (+) 17.64, , p2 -p1, ×100, * Decadal growth rate: g =, p2, where, , P1 = population of the base year, P2 = population of the present year, ** Source : Census of India, 2011(Provisional), , Population: Distribution, Density, Growth and Composition, , 5, , 2015-16
Page 6 :
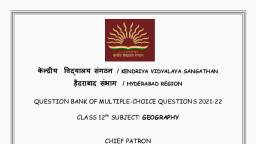
Fig. 1.3 : India – Growth of Population, Activity: Construct a choropleth map to represent Growth of population in India (2001-2011) based on data given in, Appendix– iA and compare it with the above map., , 6, , India : People and Economy, , 2015-16
Page 7 :
Phase I : The period from 1901-1921 is, referred to as a period of stagnant, or stationary phase of growth of, India’s population, since in this, period growth rate was very low,, even recording a negative growth, rate during 1911-1921. Both the, birth rate and death rate were high, keeping the rate of increase low, (Appendix–iii). Poor health and, medical services, illiteracy of people, at large and inefficient distribution, system of food and other basic, necessities were largely responsible, for a high birth and death rates in, this period., Phase II : The decades 1921-1951 are, referred to as the period of steady, population growth. An overall, improvement in health and, sanitation throughout the country, brought down the mortality rate. At, the same time better transport and, communication system improved, distribution system. The crude, birth rate remained high in this, period leading to higher growth rate, than the previous phase. This is, impressive at the backdrop of Great, Economic Depression, 1920s and, World War II., Phase III : The decades 1951-1981 are, referred to as the period of, population explosion in India,, which was caused by a rapid fall, in the mortality rate but a high, fertility rate of population in the, country. The average annual, growth rate was as high as 2.2 per, cent. It is in this period, after the, Independence, that developmental, activities were introduced through, a centralised planning process and, economy started showing up, ensuring the improvement of living, condition of people at large., Consequently, there was a high, natural increase and higher growth, rate., Besides,, increased, international migration bringing in, , Tibetans, Bangladeshis, Nepalies, and even people from Pakistan, contributed to the high growth rate., Phase IV : In the post 1981 till present, the, growth rate of country’s population, though remained high, has started, slowing down gradually (Table 1.1)., A downward trend of crude birth, rate is held responsible for such a, population growth. This was, in, turn, affected by an increase in the, mean age at marriage, improved, quality of life particularly education, of females in the country., The growth rate of population is, however,, still high in the country, and it has been, projected by World Development Report that, population of India will touch 1,350 million by, 2025., The analysis done so far shows the average, growth rate, but the country also has wide, variation (Appendix–iv) in growth rates from one, area to another which is discussed below., , R e gional V, aria, tion in, Varia, ariation, Popula, tion Gr, owth, opulation, Growth, The growth rate of population during 19912001 in Indian States and Union Territories, shows very obvious pattern., The States like Kerala, Karnataka, Tamil, Nadu, Andhra Pradesh, Odisha, Puducherry,, and Goa show a low rate of growth not exceeding, 20 per cent over the decade. Kerala registered, the lowest growth rate (9.4) not only in this group, of states but also in the country as a whole., A continuous belt of states from west to, east in the north-west, north, and north central, parts of the country has relatively high growth, rate than the southern states. It is in this belt, comprising Gujarat, Maharashtra, Rajasthan,, Punjab, Haryana, Uttar Pradesh, Uttarakhand,, Madhya Pradesh, Sikkim, Assam, West Bengal,, Bihar, Chhattisgarh, and Jharkhand, the growth, rate on the average remained 20-25 per cent., During 2001-2011, the growth rates of, almost all States and Union Territories have, registered a lower figure compared to the, previous decade, namely, 1991-2001. The, percentage decadal growth rates of the six most, populous States, namely, Uttar Pradesh,, Maharashtra, Bihar, West Bengal, Andhra, , Population: Distribution, Density, Growth and Composition, , 7, , 2015-16
Page 8 :
Pradesh and Madhya Pradesh have all fallen, during 2001-2011 compared to 1991-2001,, the fall being the lowest for Andhra Pradesh, (3.5% percentage points) and highest for, Maharashtra (6.7 percentage points). Tamil, Nadu (3.9 percentage points) and Puducherry, (7.1 percentage points) have registered some, increase during 2001-2011 over the previous, decade., , With the help of data given in Appendix i and iA, compare, the growth rate of population of different States/UTs, between 1990-2001 and 2001-2011., Take the population growth data of the districts/selected, districts of your respective state for total male and female, population and represent them with the help of, Composite Bar Graph., , An important aspect of population growth, in India is the growth of its adolescents. At, present the share of adolescents i.e., up to the, age group of 10-19 years is about 20.9 per cent, (201 1), among which male adolescents, constitute 52.7 per cent and female adolescents, constitute 47.3 per cent. The adolescent, population, though, regarded as the youthful, population having high potentials, but at the, same time they are quite vulnerable if not guided, and channelised properly. There are many, challenges for the society as far as these, adolescents are concerned, some of which are, lower age at marriage, illiteracy – particularly, female illiteracy, school dropouts, low intake of, nutrients, high rate of maternal mortality of, adolescent mothers, high rates of HIV/AIDS, infections, physical and mental disability or, retardedness, drug abuse and alcoholism, juvenile, delinquency and commitence of crimes, etc., In view of these, the Government of India, has undertaken certain policies to impart, proper education to the adolescent groups so, that their talents are better channelised and, properly utilised. The National Youth Policy is, one example which has been designed to look, , 8, , into the overall development of our large youth, and adolescent population., The National Youth Policy of Government, of India, launched in 2003, stresses on an allround improvement of the youth and, adolescents enabling them to shoulder, responsibility, towards, constructive, development of the country. It also aims at, reinforcing the qualities of patriotism and, responsible citizenship., The thrust of this policy is youth, empowerment in terms of their effective, participation in decision making and carrying, the responsibility of an able leader. Special, emphasis was given in empowering women and, girl child to bring parity in the male-female, status. Moreover, deliberate efforts were made, to look into youth health, sports and recreation,, creativity and awareness about new innovations, in the spheres of science and technology., It appears from the above discussion that, the growth rate of population is widely variant, over space and time in the country and also, highlights various social problems related to the, growth of population. However, in order to have, a better insight into the growth pattern of, population it is also necessary to look into the, social composition of population., , Popula, tion Composition, opulation, Population composition is a distinct field of, study within population geography with a vast, coverage of analysis of age and sex, place of, residence, ethnic characteristics, tribes,, language, religion, marital status, literacy and, education, occupational characteristics, etc. In, this section, the composition of Indian, population with respect to their rural-urban, characteristics, language, religion and pattern, of occupation will be discussed., Rural – Urban Composition, Composition of population by their respective, places of residence is an important indicator of, social and economic characteristics. This becomes, even more significant for a country where about, 68.8 per cent of its total population lives in village, (2011)., , India : People and Economy, , 2015-16
Page 9 :
Compare the data given in Appendix (iv) and iv A, calculate the percentages of rural population of the, states in India and represent them cartographically on, a map of India., , Do you know that India has 640,867, villages according to the Census 2011 out of, which 597,608 (93.2 per cent) are inhabited, villages? However, the distribution of rural, population is not uniform throughout the, country. You might have noted that the states, like Bihar and Sikkim have very high, percentage of rural population. The states of, Goa and Maharashtra have only little over half, of their total population residing in villages., The Union Territories, on the other hand,, have smaller proportion of rural population,, except Dadra and Nagar Haveli (53.38 per cent)., The size of villages also varies considerably. It, is less than 200 persons in the hill states of, north-eastern India, Western Rajasthan and, Rann of Kuchchh and as high as 17 thousand, persons in the states of Kerala and in parts of, Maharashtra. A thorough examination of the, pattern of distribution of rural population of, India reveals that both at intra-State and interState levels, the relative degree of urbanisation, and extent of rural-urban migration regulate, the concentration of rural population., You have noted that contrary to rural, population, the proportion of urban population, (31.16 per cent) in India is quite low but it is, showing a much faster rate of growth over the, decades. The growth rate of urban population, has accelerated due to enhanced economic, development and improvement in health and, hygienic conditions., The distribution of urban population too,, as in the case of total population, has a wide, variation throughout the country (Appendix–iv)., , a considerable increase of urban population., This indicates both development of urban areas, in terms of socio-economic conditions and an, increased rate of rural-urban migration. The, rural-urban migration is conspicuous in the, case of urban areas along the main road links, and railroads in the North Indian Plains, the, industrial areas around Kolkata, Mumbai,, Bengaluru – Mysuru, Madurai – Coimbatore,, Ahmedabad – Surat, Delhi – Kanpur and, Ludhiana – Jalandhar. In the agriculturally, stagnant parts of the middle and lower Ganga, Plains, Telengana, non-irrigated Western, Rajasthan, remote hilly, tribal areas of northeast, along the flood prone areas of Peninsular, India and along eastern part of Madhya, Pradesh, the degree of urbanisation has, remained low., Linguistic Composition, India is a land of linguistic diversity. According, to Grierson (Linguistic Survey of India, 1903 –, 1928) there were 179 languages and as many, as 544 dialects in the country. In the context of, modern India, there are about 22 scheduled, languages and a number of non-scheduled, languages. See how many languages appear, on a ten Rs note. Among the scheduled, languages, the speakers of Hindi have the, highest percentage. The smallest language, groups are Kashmiri and Sanskrit speakers., However, it is noticed that the linguistic regions, in the country do not maintain a sharp and, distinct boundary, rather they gradually merge, and overlap in their respective border zones., Linguistic Classification, The speakers of major Indian languages, belong to four language families, which have, their sub-families and branches or groups., This can be better understood from Table 1.2., Religious Composition, , Compare the data of Appendix (iv) and iv A and identify, the states/UTs with very high and very low proportion of, urban population., , It is, however, noticed that in almost all, the states and Union Territories, there has been, , Religion is one of the most dominant forces, affecting the cultural and political life of the most, of Indians. Since religion virtually permeates, into almost all the aspects of people’s family and, community lives, it is important to study the, religious composition in detail., , Population: Distribution, Density, Growth and Composition, , 9, , 2015-16
Page 10 :
Table 1.2 : Classification of Modern Indian Languages, Family, , Sub-Family, Austro-Asiatic, , Austric, (Nishada), 1.38%, , Branch/Group, , Speech Areas, , Mon-Khmer, , Meghalaya, Nicobar Islands, , Munda, , West Bengal, Bihar, Orissa, Assam,, Madhya Pradesh, Maharashtra, , Austro- Nesian, , Outside India, South-Dravidian, , Tamil Nadu, Karnataka, Kerala, , Central Dravidian, , Andhra Pradesh, M.P., Orissa,, Maharashtra, , North Dravidian, , Bihar, Orissa, West Bengal,, Madhya Pradesh, , Tibeto-Himalayan, , Jammu & Kashmir, Himachal Pradesh,, Sikkim, , North Assam, , Arunachal Pradesh, , Siamese-Chinese, , Assam- Myanmari, , Assam, Nagaland, Manipur, Mizoram,, Tripura, Meghalaya, , Indo-Aryan, , Iranian, , Outside India, , Dardic, , Jammu & Kashmir, , Indo-Aryan, , Jammu & Kashmir, Punjab, Himachal, Pradesh, U.P., Rajasthan, Haryana, M.P.,, Bihar, Orissa, West Bengal, Assam,, Gujarat, Maharashtra, Goa., , Dravidian, (Dravida), 20%, , Tibeto – Myanmari, Sino-Tibetan, (Kirata), 0.85%, , Indo –, European, (Aryan) 73%, , Source : Ahmed, A. (1999) : Social Geography, Rawat Publication, New Delhi, , Table 1.3 : Religious Communities of India, 2001, , Look at Table 1.2 and prepare a pie diagram of linguistic, composition of India showing the sectoral shares of, each linguistic group., Or, Prepare a qualitative symbol map of India showing the, distribution of different linguistic groups in the country., , The spatial distribution of religious, communities in the country (Appendix–v) shows, that there are certain states and districts having, large numerical strength of one religion, while, the same may be very negligibly represented in, other states., Hindus are distributed as a major group in, many states (ranging from 70 - 90 per cent and, above) except the districts of states along IndoBangladesh border, Indo-Pak border, Jammu &, Kashmir, Hill States of North-East and in scattered, areas of Deccan Plateau and Ganga Plain., , Religious, , 2001, , Groups, , Population, (in million), , % of Total, , Hindus, , 827.6, , 80.5, , Muslims, , 138.2, , 13.5, , Christians, , 24.1, , 2.3, , Sikhs, , 19.2, , 1.9, , Buddhists, , 8.0, , 0.9, , Jains, , 4.2, , 0.4, , Others, , 6.6, , 0.6, , Muslims, the largest religious minority, are, concentrated in Jammu & Kashmir, certain, districts of West Bengal and Kerala, many, districts of Uttar Pradesh , in and around Delhi, and in Lakshadweep. They form majority in, Kashmir valley and Lakshadweep., , 10 India : People and Economy, , 2015-16
Page 11 :
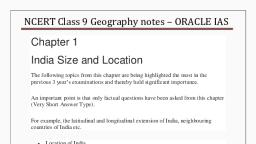
Religion and Landscape, Formal expression of religions on, landscape is manifested through sacred, structures, use of cemetries and, assemblages of plants and animals, groves, of trees for religious purposes. Sacred, structures are widely distributed throughout, the country. These may range from, inconspicuous village shrines to large Hindu, temples, monumental masjids or ornately, designed cathedrals in large metropolitan, cities. These temples, masjids, gurudwaras,, monastries and churches differ in size,, form, space – use and density, while, attributing a special dimension to the total, landscape of the area., , The Christian population is distributed, mostly in rural areas of the country. The main, concentration is observed along the Western, coast around Goa, Kerala and also in the hill, states of Meghalaya, Mizoram, Nagaland,, Chotanagpur area and Hills of Manipur., Sikhs are mostly concentrated in relatively, small area of the country, particularly in the, states of Punjab, Haryana and Delhi., Jains and Buddhists, the smallest religious, groups in India have their concentration only, in selected areas of the country. Jains have, major concentration in the urban areas of, Rajasthan, Gujarat and Maharashtra, while the, Buddhists are concentrated mostly in, Maharashtra. The other areas of Buddhist, majority are Sikkim, Arunachal Pradesh,, Ladakh in Jammu & Kashmir, Tripura, and, Lahul and Spiti in Himachal Pradesh., The other religions of India include, Zoroastrians, tribal and other indigenous faiths, and beliefs. These groups are concentrated in, small pockets scattered throughout the country., Composition of Working Population, The population of India according to their, economic status is divided into three groups,, namely; main workers, marginal workers and, non-workers., It is observed that in India, the proportion, of workers (both main and marginal) is only 39.8, , Standard Census Definition, Main Worker is a person who works for, atleast 183 days ( or six months) in a year., Marginal Worker is a person who works for, less than 183 days ( or six months) in a year., , per cent (2011) leaving a vast majority of about, 60 per cent as non-workers. This indicates an, economic status in which there is a larger, proportion of dependent population, further, indicating possible existence of large number of, unemployed or under employed people., What is work participation rate?, , The proportion of working population, of, the states and Union Territories show a, moderate variation from about 39.6 per cent in, Goa to about 49.9 per cent in Daman and Diu., The states with larger percentages of workers, are Himachal Pradesh, Sikkim, Chhattisgarh,, Andhra Pradesh, Karnataka, Arunachal, Pradesh, Nagaland, Manipur and Meghalaya., Among the Union Territories, Dadra and Nagar, Haveli and Daman and Diu have higher, participation rate. It is understood that, in the, context of a country like India, the work, participation rate tends to be higher in the areas, of lower levels of economic development since, number of manual workers are needed to, perform the subsistence or near subsistence, economic activities., The occupational composition (see box), of India’s population (which actually means, engagement of an individual in farming,, manufacturing trade, services or any kind of, professional activities) shows a large proportion, of primary sector workers compared to, secondary and tertiary sectors. About 54.6 per, cent of total working population are cultivators, and agricultural labourers, whereas only 3.8%, of workers are engaged in household industries, and 41.6 % are other workers including nonhousehold industries, trade, commerce,, construction and repair and other services. As, far as the occupation of country’s male and, female population is concerned, male workers, out-number female workers in all the three, sectors (Fig.1.4 and Table 1.4)., , Population: Distribution, Density, Growth and Composition, , 11, , 2015-16
Page 12 :
Fig. 1.4 : India – Occupational Structure, 2011, , Identify some issues in which, India is ahead of or lagging, behind its neighbours., , 12 India : People and Economy, , 2015-16
Page 13 :
The number of female workers is relatively, high in primary sector, though in recent years, there has been some improvement in work, The 2001 Census has divided the working, participation of women in secondary and, population of India into four major categories:, tertiary sectors., 1. Cultivators, It is important to note that the proportion, 2. Agricultural Labourers, of workers in agricultural sector in India has, 3. Household Industrial Workers, shown a decline over the last few decades (58.2%, in 2001 to 54.6% in 2011). Consequently, the, 4. Other Workers., participation rate in secondary and tertiary sector, has registered an increase. This indicates a shift, of dependence of workers from farmTable 1.4 : Sectoral Composition of work force in India, 2011 based occupations to non-farm, based ones, indicating a sectoral shift, Categories, Population, in the economy of the country., The spatial variation of work, Persons, % to, Male, Female, participation rate in different sectors, total, in the country (Appendix–v and vA), Workers, is very wide. For instance, the states, like Himachal Pradesh and Nagaland, Primary, 26,30,22,473, 54.6, 16,54,47,075 9,75,75,398, have very large shares of cultivators., Secondary, 1,83,36,307, 3.8, 97,75,635, 85,60,672, On the other hand states like Bihar,, Tertiary, 20,03,84,531, 41.6, 15,66,43,220 4,37,41,311, Andhra Pradesh, Chhattisgarh,, Odisha, Jharkhand, West Bengal, and Madhya Pradesh have higher proportion of, agricultural labourers. The highly urbanised, areas like Delhi, Chandigarh and Puducherry, have a very large proportion of workers being, Prepare composite bar graphs, one for India and the engaged in other services. This indicates not only, other for your respective states showing the proportion availability of limited farming land, but also large, of male and female workers in agriculture, household scale urbanisation and industrialisation, industries and other sectors, and compare., requiring more workers in non-farm sectors., , Occupational Categories, , EXERCISES, 1., , Choose the right answers of the followings from the given options., (i), India’s population as per 2011 census is :, (a) 1028 million, (c), 3287 million, (b), , 3182 million, , (d), , 1210 million, , Population: Distribution, Density, Growth and Composition, , 13, , 2015-16
Page 14 :
(ii), , (iii), , (iv), , 2., , (b) Kerala, (d) Punjab, Which one of the following states has the highest proportion of urban, population in India according to 2011 Census?, (a) Tamil Nadu, (c), Kerala, (b) Maharashtra, (d) Goa, Which one of the following is the largest linguistic group of India?, (a) Sino – Tibetan, (c), Austric, , (b) Indo – Aryan, (d), Dravidian, Answer the following questions in about 30 words., (i), Very hot and dry and very cold and wet regions of India have low density, of population. In this light, explain the role of climate on the distribution, of population., (ii), (iii), (iv), , 3., , Which one of the following states has the highest density of population in, India?, (a) West Bengal, (c), Uttar Pradesh, , Which states have large rural population in India? Give one reason for, such large rural population., Why do some states of India have higher rates of work participation than, others?, ‘The agricultural sector has the largest share of Indian workers.’ – Explain., , Answer the following questions in about 150 words., (i), Discuss the spatial pattern of density of population in India., (ii), Give an account of the occupational structure of India’s population., , 14 India : People and Economy, , 2015-16