Page 2 :
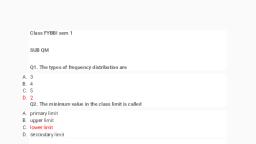
STATISTICS, It is a branch of science which is deal with collection of data, organization or classification of data and interpretation of data in a systematic manner for a specific purpose.
Page 3 :
Longman Dictionary , “ Statistics is a collection of numbers which represent facts or measurement”
Page 4 :
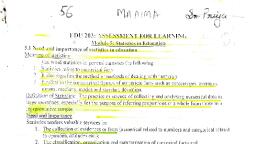
What is the purpose of statistics in education ?
Page 5 :
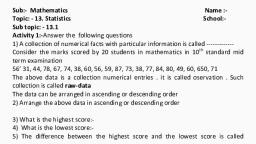
Following marks are obtained by a group of students in Chemistry examination (N=40), 42 88 37 75 98 93 73 62, 96 80 52 76 66 54 73 69, 83 62 53 79 69 59 81 75, 52 65 49 80 67 59 88 80, 44 71 72 87 91 82 89 79
Page 6 :
Step 1, Find range of the following distribution, , Step 2, Let the class interval be 5, the no of class interval be approximately 12, , Step 3, Draw frequency distribution table
Page 7 :
Sum of f=N=40
Page 9 :
Statistics , , , Inferential descriptive
Page 10 :
INFERENTIAL STATISTICS, Allows you to make inferences about the population from the sample data. , representation , , , , , , making conclusion, POPULATION, SAMPLE
Page 11 :
DESCRIPTIVE STATISTICS, No conclusions are extended beyond groups, It does not involve the process of sampling, It limits generalization, Descriptive statistics in short, help describe and understand the features of a specific data set up giving short summaries about the sample and measures of the data.
Page 12 :
Terms in statistics, Sample , A sample refers to a smaller, manageable version of a larger group., It is a subset containing the characteristics of a larger population., A sample should represent the population as a whole and not reflect any bias toward a specific attribute
Page 13 :
Population , Population is a set of similar items or events which is of interest some question or experiment, Statistics , The mathematical characteristics of sample , Parameters, The mathematical characteristics of population, Frequency , The no of times the event occurred in an experiment or study
Page 14 :
Descriptive statistics, Measures of central tendency, Mean , Median , Mode , Measures of dispersion , Range , Mean deviation , Standard deviation , Quartile deviation
Page 15 :
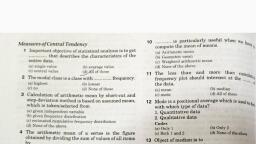
MEASURES OF CENTRAL TENDANCY, These measures are also called as statistical averages or averages. , It is a value around which all the observations have a tendency to cluster., This value is considered as the most representative figure of the entire data set., Common measures of central tendencies are Mean, Median and Mode.
Page 16 :
A frequency distribution representing some natural phenomena the scores tend to cluster about a point somewhere in between the extremes. This tendency is commonly known as central tendency of the scores., Purpose, It give a general picture of the variable measured in a large group, It provides the basis of comparison with other group
Page 17 :
Mean, Arithmetic mean, It is ordinary average in arithmetic., In an ungrouped data arithmetic mean equals sum of the scores divided by the total no. of scores., uses, When needed greater stability and reliability, For calculating other statistics such as standard deviation , coefficient of correlation etc are to be calculated using mean.
Page 18 :
Advantages of Mean, It is precisely defined and its value is always definite, It is easy to calculate and simple to understand, It is based up on all the scores in a distribution therefore it is the most representative average., It is useful in computing any other statistical measures.
Page 19 :
Demerits of Mean, If a distribution is not even , the reliability of the mean decreases., If a single item of the distribution is missing, the mean can not be calculated, Mean is calculated from all the items of the distribution , the abnormally large or small items may considerably affect the size of the mean.
Page 20 :
Median, Median is the middle score of the set of scores, We are arranging a set of values either ascending or descending order of their magnitude., When N is odd – median is the middle most value, When N is even –median is the arithmetic mean of two middle values. , It is not effected by extreme scores, It can not be used for computing other statistical measures
Page 21 :
Mode, Mode can be defined as the measure which occur more frequently or most frequently ., It eliminates extreme variations, It is not based on all the observation in a distribution , It is not helpful for further mathematical treatment
Page 22 :
Measures of dispersion/ measures of variability, Statistical measure used to determine the nature and extent of dispersion of the scores, Range , Quartile deviation, Standard deviation, Mean deviation
Page 23 :
Range, Difference between the highest and lowest score in a distribution, It help us to make only a rough comparison of two or more groups, It take in to consider only the extremes, When N is too small , it may be unreliable
Page 24 :
Quartile deviation/ semi inter-quartile range, Quartile deviation is half the difference between the third quartile and the first quartile, Use, When median is taken as the measure of central tendency, When details of the distribution at either end is not available.
Page 25 :
Standard deviation, We square the deviation is the square root of the average (mean) of the squares of deviations of the scores taken from the mean, The average of the squares of deviations is usually known as the variance of the distributions, Sd is the square root of the variance
Page 26 :
It is well defined and its value is definite, It is based on all the scores in the data, It is used in many advanced statistical studies, It is less effected by fluctuations in sampling, Greatest stability and reliability, When coefficient of correlation and other statistics are subsequently to be computed
Page 27 :
Mean deviations, Mean deviation is the average of the deviations of the scores, taken from the mean, Average deviation, The deviation of scores from mean can either positive or negative. But the signs are not considered while calculating mean deviations, MD=Σ fX!/N
Page 28 :
Correlation, It is a statistical tool that helps to measure and analyse the degree of relationship between two variables., The measure of correlation is called correlation coefficient, The degree of relationship is expressed by coefficient which range from correlation (-1 to +1), The correlation analysis enables us to have an idea about the degree and direction of relationship between the two variables under study
Page 29 :
Types of correlation, Positive correlation, Negative correlation, Zero correlation
Page 30 :
Use of coefficient of correlation, It helps to determine the validity of a test, Reliability, Indicates the nature of relationship between two variables, It helps to ascertain the traits and capacities of pupils, It predict the value of one variable given the value of another related variable
Page 31 :
Calculation of coefficient of correlation, The product moment correlation , Rank order correlation
Page 32 :
Karl Pearson product moment coefficient of correlation, Most common, r measure the degree of linear relationship between two variables say X and Y, If r=+1 , the correlation between the two variable is perfect and positive, If r=-1, the correlation between the two variable is said to be perfect and negative , If r=0, there exists no correlation, rxy=1/N (Σ xy/σx. Σy)
Page 33 :
Spearmen’s rank order correlation, The spearman’s rank order correlation is the nonparametric version of Pearson's product moment correlation, Measures the strength and direction of association between two ranked variables, Give the degree of relationship between two sets of variables when data are in the form of rank, Spearman rho values always remains between +1 to -1
Page 34 :
Normal probability curve
Page 35 :
Properties of normal probability curve, It is bell shaped, It is symmetrical , The majority of scores will show a tendency to cluster round the centre., All the three measures of central tendency of a normal curve coincide , that is , they are all equal, The first and third quartiles are equidistance from the median, The ordinate at the mean is the highest, The curve will gradually go on nearer and nearer to the base line, but it will never meet the base line
Page 36 :
If the total area enclosed by the normal probability curve is represented by N, In a normal distribution 34.13% cases will be distributed between M and a score at a distance of 1sigma from M. , 68.26% cases are included between +1sigma to -1 sigma from M, The curve has point of inflection (turning point), For a normal curve skewness is zero and kurtosis is 0.263
Page 37 :
Graphical representation of measures, Easy visualization, Data can be easily understood just by a glance, Facilitate comparative study, Helps to observing the data, Proper analysis of data, Interpretation and draw conclusions
Page 38 :
Histogram, Graph in which frequencies are represented by bars, arranging on touching the next, The height of the bar represents the frequency of the class, Frequency of each class is represented by a separate bar covering the interval, The scores are marked in x-axis and frequencies are in y-axis, The area of rectangle is proportionate to its frequency, It is simple and easily constructed
Page 39 :
Frequency polygon, frequency polygon is a graphic representation of a given frequency distribution. It is always a closed figure., Frequency polygon gives a less accurate representation of the distribution than a histogram. , Advantages , It is simple and easy to construct, Possible to superimpose more than one frequency polygon on the same graph, Comparison of several frequency distributions can be possible, It can be smoothened
Page 40 :
Ogive, An ogive is a way to graph information showing cumulative frequencies, Where x- axis represents upper class/ interval boundaries and y-axis represents cumulative frequencies, Percentile rank, They are position measures used in educational field to indicate the position of an individual in group., Where divide the data set in to 100 equal groups, Percentile rank indicate the percentage of data value that fall below the specified rank.
Page 41 :
Pie diagram, Pie diagram is a valuable type of graph used to visualize relative parts of a whole., It is a qualitative representation of data., Easily constructed and visualization helpful for the analysis of data, Comparison of data is possible, Analysis , interpretation and conclusion formation are possible