Page 1 :
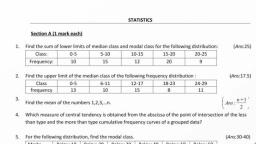
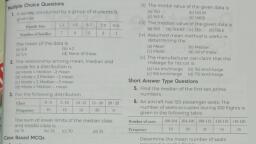
myCBSEguide.com, A Complete guide for CBSE students, , To represent ‘the less than type’ graphically, we plot the, , a. class marks, b. class size, , c. lower limits, d. upper limits, , CBSE Test Paper 02, Chapter 14 Statistics, , Upperclasslimit+Lowerclasslimit _, , 2, , a. frequency, b. Class mark, , c. None of these, , d. class size, , 169), , The mean of the first 10 prime numbers is (1), , a. 129, b. 1.29, ce 12.9, d. 11.9, , The mean of the first 10 natural odd numbers is (1), , a 9, b., c i, d. 10, , For the following distribution, , on the x — axis. (1), , , , Class, , 60-70, , 70-80, , 80-90, , 90-100, , 100-110, , , , , , Frequency, , , , 10, , , , 15, , , , 12, , , , 20, , , , 9, , , , Material downloaded from myCBSEguide.com., , 1/14
Page 2 :
& myCBSEguide.com, , A Complete guide for CBSE students, , the sum of lower limits of the median class and modal class is (1), , a. 190, b. 20, c. 180, d. 170, , 6. If the mean and mode of a frequency distribution be 53.4 and 55.2 respectively, find, the median. (1), , 7. Find the mode of the following data: (1), 15, 8, 26, 25, 24, 15, 18, 20, 24, 15, 19, 15, , 8. In the table given below, the times taken by 120 athletes to.run a 100-m hurdle race, are given., , , , Class 13.8-14 | 14-142} 142-144 | 144-146 | 146-148) 14.8-15, , , , , , , , , , , , , , , , , , Frequency 2 4 15 54 25 20, , , , , , Find the number of athletes who completed the race in less than 14.6 seconds. (1), , 9. What is the lower limit of the modal class of the following frequency distribution?, , , , Age(in years) 0-10 | 10-20 | 20-30 | 30-40 | 40-50 | 50-60, , , , Number of patients 16 13 6 +t Zi 18, , , , , , , , , , , , , , , , , , , , 10. Find the class marks of classes 10 - 25 and 35 - 55. (1), , 11. Convert the following cumulative distribution to a frequency distribution: (2), , , , , , Height (in | less than | less than | less than | less than | less than | less than, cm) 140 145 150 155 160 165, Number of, 4 11 29 40 46 Sa, students, , , , , , , , , , , , , , , , , , , , 12. A class teacher has the following absentee record of 40 students of a class for the, , Material downloaded from myCBSEguide.com. 2/14
Page 3 :
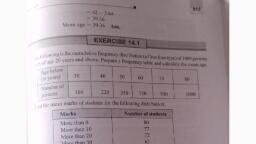
& myCBSEguide.com, , A Complete guide for CBSE students, , whole term. Find the mean number of days a student was absent. (2), , , , Number of days, , 0-6 | 6-10, , 10-14, , 14-20, , 20-28, , , , Number of students, , it 10, , , , , , , , 7, , t, , , , , , 4, , , , , , , , 13. Candidates of four schools appear in a mathematics test. The data were as follow:, , , , , , , , , , , , , , , , , , Schools No. of Candidates Average Score, rE 60 Ee, IL 48 80, Il Not available 55, IV 40 50, , , , If the average score of the candidates of all the four schools is 66, find the number of, candidates that appeared from school III. (2), , , , , , , , , , , , , , , , , , , , , , , , , , 14., Marks Number of students, , 0 and above 80, 10 and above 77, 20 and above 72, 30 and above 65, 40 and above 55, 50 and above 43, 60 and above 28, 70 and above 16, 80 and above 10, 90 and above 8, 100 and above 0, , , , , , , , Material downloaded from myCBSEguide.com., , 3/14
Page 4 :
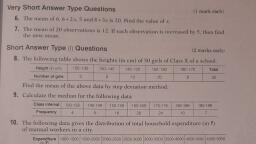
& myCBSEguide.com, , A Complete guide for CBSE students, , Write the proper data (marks) and frequency (Number of students). (3), , 15. During a medical check-up, the number of heartbeats per minute of 30 patients were, recorded and summarised as follows:, , , , Number of heartbeats per 65- | 68- | 71- | 74- | 77- | 80- | 83minute 68 71 74 77 80 83 86, , , , , , , , , , , , , , , , , , , , Number of patients 2 4 3 8 7 4 2, , , , , , Find the mean of heartbeats per minute for these patients, choosing a suitable, method. (3), , 16. The following table gives the distribution of total household expenditure (in rupees), of manual workers in a city., , , , 100- 150- 200- 250- 300- 350- 400- 450, Expenditure, 150 200 250 300 350 400 450 500, , , , Frequency 24 40 33 28 30 22 16 7, , , , , , , , , , , , , , , , , , , , , , , , Find the average expenditure (in Rs.) per household. (3), , 17. The percentage of various categories of workers in a state is given in the following, table. Present the information in the form of a pie chart (3), , , , , , , , , , , , , , , , Categories of workers %, Cultivators 40.3, Agriculture laboure 25, Industrial workers 12.5, Commercial workers 9.7, Others 12.5, Total 100.00, , , , , , , , , , 18. Draw ‘more than’ ogive for the following distribution. Find the median from the, , Material downloaded from myCBSEguide.com. 4/14
Page 5 :
& myCBSEguide.com, , A Complete guide for CBSE students, , curve: (4), , , , Marks 0-10 10-20 20-30 30-40 40 - 50, , , , No. of students 10 18 40 20 12, , , , , , , , , , , , 19. Find the mode, median and mean for the following data: (4), , , , Marks Obtained 25-35 | 35-45 | 45-55 | 55-65 | 65-75,|~75-85, , , , , , , , , , , , , , , , Number of students 7 31 33 17 11 1, , , , , , , , 20. The median of the following data is 525. Find the values of x and y if the total, frequency is 100. (4), , , , Class 0- | 100- | 200- | 300- | 400- | 500- | 600- | 700- | 800- | 900Interval | 100; 200 | 300 | 400 | 500 | 600 | 700 | 800 | 900 | 1000, , , , , , , , , , , , , , , , , , , , , , , , , , Frequency) 2 | 5 =x |Q@aa—|717 | g2od| y 9 7 4, , , , , , Material downloaded from myCBSEguide.com. 5/14
