Page 1 :
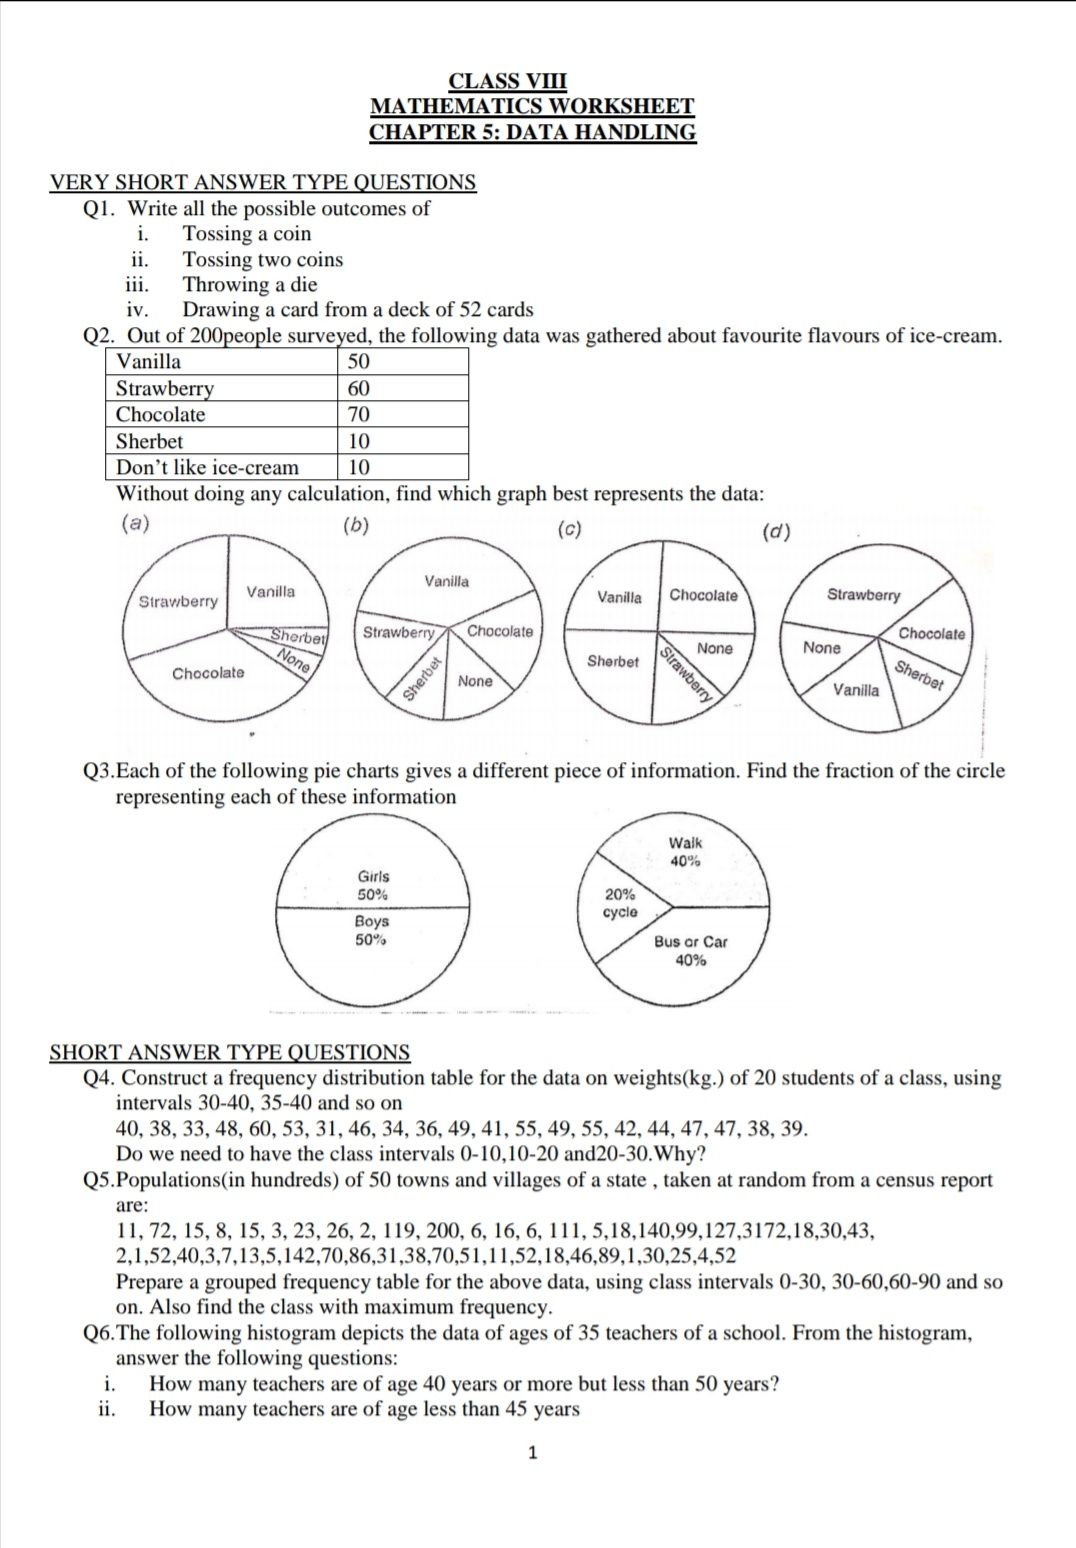
CLASS VOI, MATHEMATICS WORKSHEET, CHAPTER 5: DATA HANDLING, , VERY SHORT ANSWER TYPE QUESTIONS, QI. Write all the possible outcomes of, i. Tossing a coin, ii. Tossing two coins, iii. Throwing a die, iv. Drawing a card from a deck of 52 cards, Q2. Out of 200people surveyed, the following data was gathered about favourite flavours of ice-cream., , , , , , , , , , , , , , , , , , , , Vanilla 50, , Strawberry 60, , Chocolate 70, , Sherbet 10, , Don’t like ice-cream 10, , Without doing any calculation, find which graph best represents the data:, (a) (d) (co) 0), , Vanilla, , Chocolate, , ISN, , Q3.Each of the following pie charts gives a different piece of information. Find the fraction of the circle, representing each of these information, , Boys, 50% Bus or Car, 40%, , di, , Chocolate, , , , SHORT ANSWER TYPE QUESTIONS, Q4. Construct a frequency distribution table for the data on weights(kg.) of 20 students of a class, using, intervals 30-40, 35-40 and so on, 40, 38, 33, 48, 60, 53, 31, 46, 34, 36, 49, 41, 55, 49, 55, 42, 44, 47, 47, 38, 39., Do we need to have the class intervals 0-10,10-20 and20-30.Why?, Q5.Populations(in hundreds) of 50 towns and villages of a state , taken at random from a census report, are:, 11, 72, 15, 8, 15, 3, 23, 26, 2, 119, 200, 6, 16, 6, 111, 5,18,140,99,127,3172,18,30,43,, 2,1,52,40,3,7,13,5,142,70,86,31,38,70,51,11,52,18,46,89,1,30,25,4,52, Prepare a grouped frequency table for the above data, using class intervals 0-30, 30-60,60-90 and so, on. Also find the class with maximum frequency., Q6.The following histogram depicts the data of ages of 35 teachers of a school. From the histogram,, answer the following questions:, i, | How many teachers are of age 40 years or more but less than 50 years?, ii. How many teachers are of age less than 45 years, , , , 1
